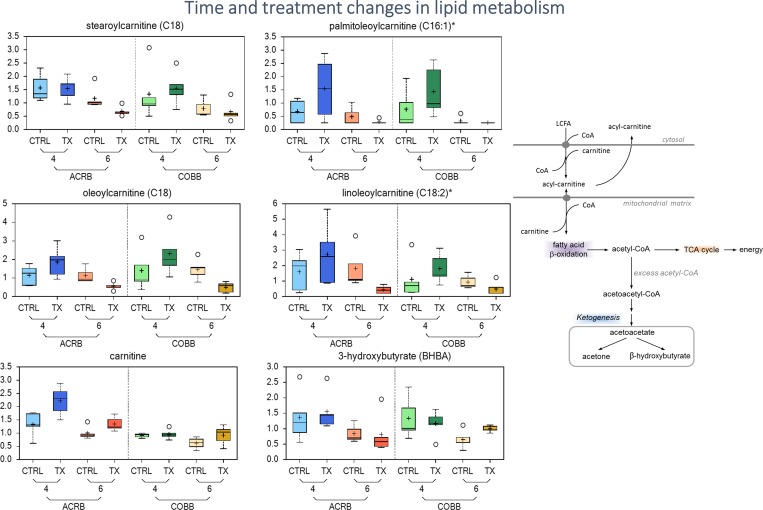
Fig 9. Differences in abundance of lipid metabolites in chicken genotypes (ACRB and COBB) infected with Eimeria acervulina (TX) and their control (CTRL) at 4 and 6 days post infection.
The adjusted P-values for significant comparison are presented in S2 Table. The upper whiskers represent the maximum, and the lower whiskers the minimum values. The plus-signs indicate the mean values, while the median values are represented by the black line within the boxes.

