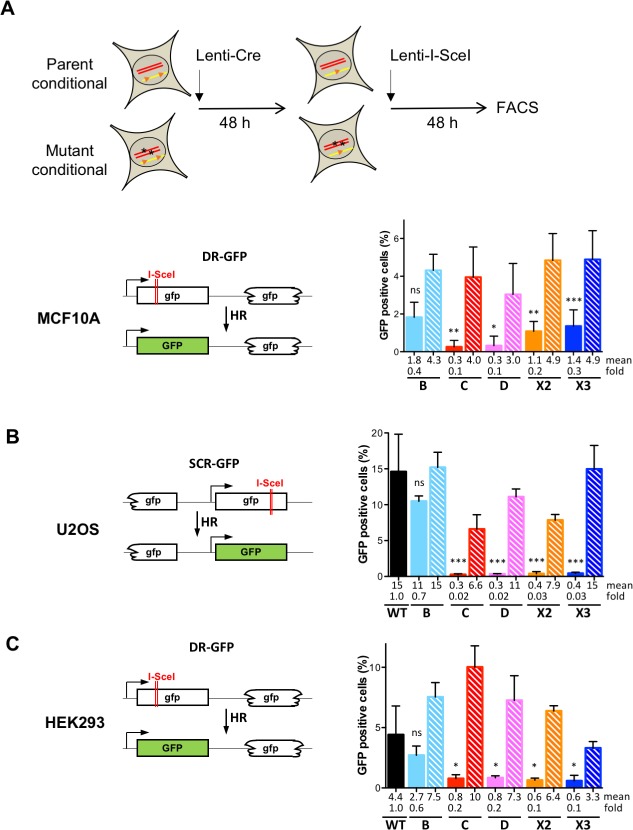
Fig 3. RAD51 paralog disruption leads to homologous recombination deficiency.
(A) Schematics showing experimental scheme to transiently perform HR assay. Since RAD51 paralogs in MCF10A cells (except RAD51B) were inviable after Cre expression, the analysis was performed 2 days post-Cre infection when the mutant cells were still alive. Post-Cre mutant and parental cells were infected with I-SceI–expressing lenti-virus for 48 h. GFP+ cells were measured by FACS. Schematic of the I-SceI-inducible direct repeat recombination reporter integrated in the genome of MCF10A [43,81]. Filled and hatched bars represent the mutant and parental cells, respectively. Data are presented as means +/- SD from at least three independent experiments. Differences between post-Cre mutant and parental cells were statistically analyzed using unpaired one-way ANOVA and Tukey's test. *p < 0.05, ** p < 0.01, *** p < 0.001, ns not significant. (B, C) Schematic of the I-SceI-inducible direct repeat recombination reporter integrated in the genome of U2OS [67] and HEK293 [84] cells. Cells were transfected with I-SceI-expressing plasmid and GFP+ cells were measured. Filled and hatched bars are for the mutant cells and the mutant cells stably complemented with a retroviral construct expressing the corresponding wild-type allele, respectively. Data are presented as means +/- SD from at least three independent experiments. Differences between mutant and wild-type cells were statistically analyzed using unpaired one-way ANOVA and Tukey's test. * p < 0.05, ** p < 0.01, *** p < 0.001, ns not significant. Comparisons between complemented and wild-type cells were respectively in U2OS and HEK293, B ns, C ***, D ns, X2 *** and X3 ns; and B ns, C ***, D ns, X2 ns and X3 ns (not indicated in the figure). Comparisons between complemented and mutant cells were respectively in U2OS and HEK293, B **, C ***, D ***, X2 *** and X3 ***; and B **, C ***, D ***, X2 ** and X3 ns (not indicated in the figure).

