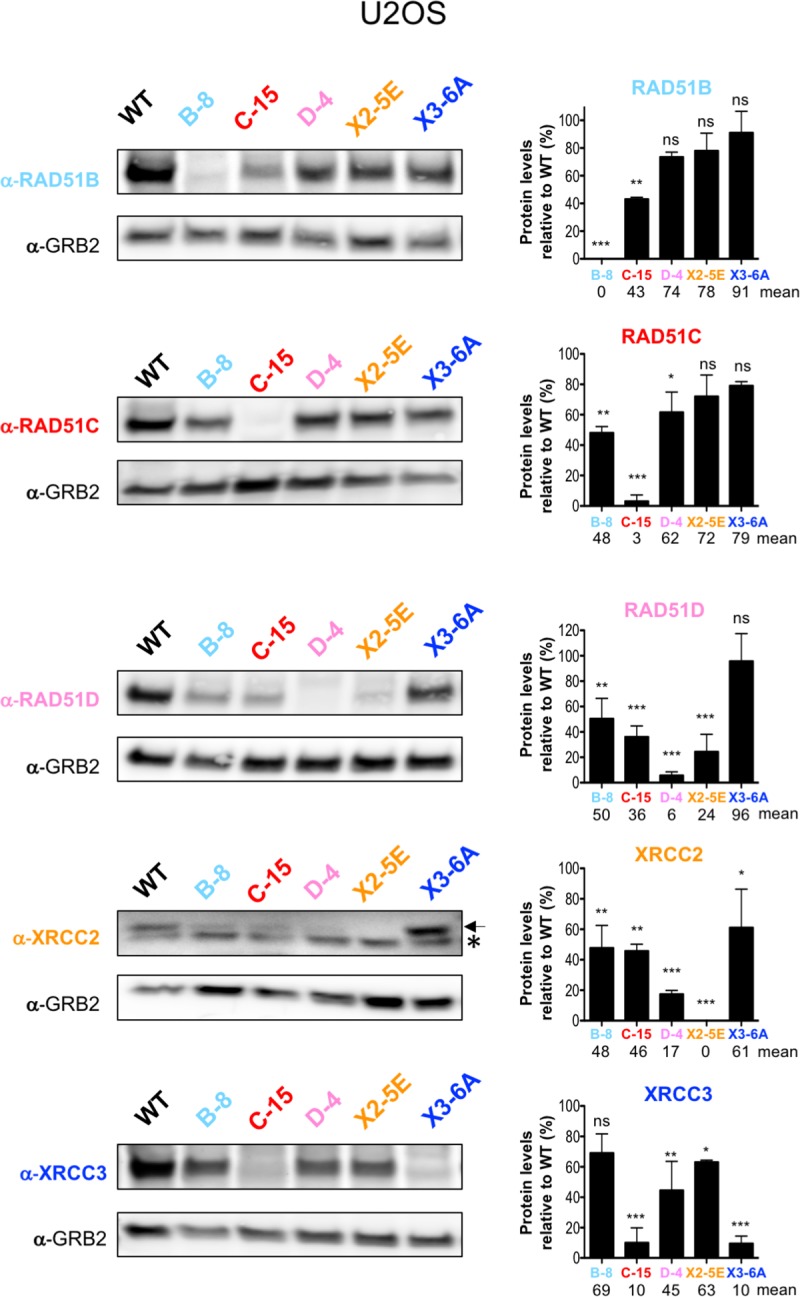
Fig 6. RAD51 paralog protein levels in mutants.

Immunoblots of crude cellular extracts from wild-type cells and mutant U2OS cells. GRB2 was used as loading control. Arrow indicates XRCC2 specific band whereas * indicates a non-specific band. The intensities of RAD51 paralogs protein bands were normalized to the GRB2 signal and the quantification is expressed in relative % to the levels detected in wild-type cells. Differences between protein levels detected in mutant versus wild-type cells were statistically analyzed using unpaired one-way ANOVA and Tukey's test. *p < 0.05, ** p < 0.01, *** p < 0.001, ns not significant.
