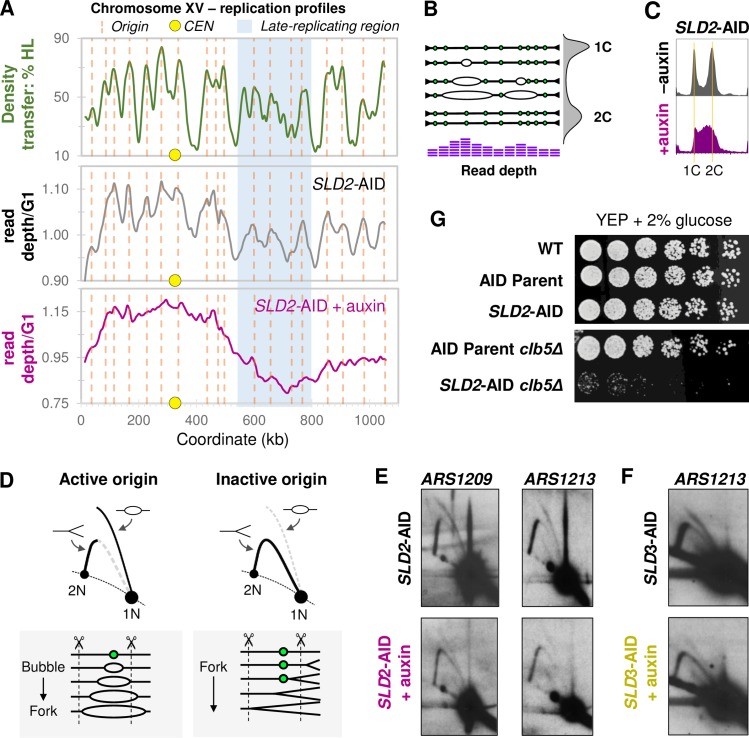
Fig 4. Analysis of replication at unique origins.
(A) Whole genome sequencing (WGS)-based replication profiles for Chr XV in SLD2-AID. A replication profile for Chr XV based on WGS read-depth for untreated SLD2-AID is shown in the center panel and compared to our previously published replication data determined from a density transfer-to-microarray experiment (top panel; based on data from [82]). We define marker frequency as the read depth normalized to sequencing depth for G1-arrested cells. The vertical dotted orange lines correspond to confirmed origins in OriDB [86] that are detected in both the density transfer and the uninduced SLD2-AID WGS profiles. The yellow circle marks the centromere and the region highlighted in blue indicates the late-replicating domain. The bottom panel shows the WGS read-depth profile for the SLD2-AID strain treated with auxin for two hours. (B) Illustration of a single chromosome and how marker frequency, as measured by whole genome sequencing, reflects initiation of DNA replication based on variable origin efficiency and firing time (illustration adapted from [62]). A flow cytometry profile is shown on the right to illustrate the variable DNA content in a population of cycling cells. For haploid cells, the G1 population contains one copy of the example chromosome and the G2 population has two copies. In S phase cells, copy number along the length of the chromosome varies due to active replication bubbles. Active origins will generate local maxima in read depth, while regions where replication forks converge (termini), produce local minima. Read depth at origins that fire early in S phase will be high, while read depth at late-firing as well as inefficient origins will be lower. Large-scale chromosome regions replicated early in S phase (for example, CEN-proximal regions) will have higher average read depth and regions replicated late in S phase (for example, subtelomeric regions) will have lower average read depth. (C) Flow cytometry profiles for asynchronous SLD2-AID collected for whole genome sequencing. Orange lines indicate 1C and 2C DNA cells. The two-hour auxin treatment of SLD2-AID cells causes more than 50% of the cells to be distributed throughout S phase. (D) Illustration of expected 2D gel signal at an active vs. inactive origin. Arrows mark the positions of bubble and Y intermediates. The line diagrams below the 2D gel diagrams illustrate how replication forks move through the hypothetical restriction fragment (delimited by the dotted lines) containing an asymmetrically-located potential origin (closed green circle). At active origins, the bubble arc signal predominates and converts to large Ys as one of the forks passes the closest restriction site. However, when the origin fails to fire, the restriction fragment generates a uniform Y arc as forks from an adjacent origin pass through the fragment. (E) ARS1209 and ARS1213 2D gel analysis for SLD2-AID. (F) ARS1213 2D gel analysis for SLD3-AID. (G) Spot test of SLD2-AID clb5Δ strain growth and viability. Cell cultures were serially diluted 1:3, spotted onto YEPD, grown at 30°C for three days and then photographed.

