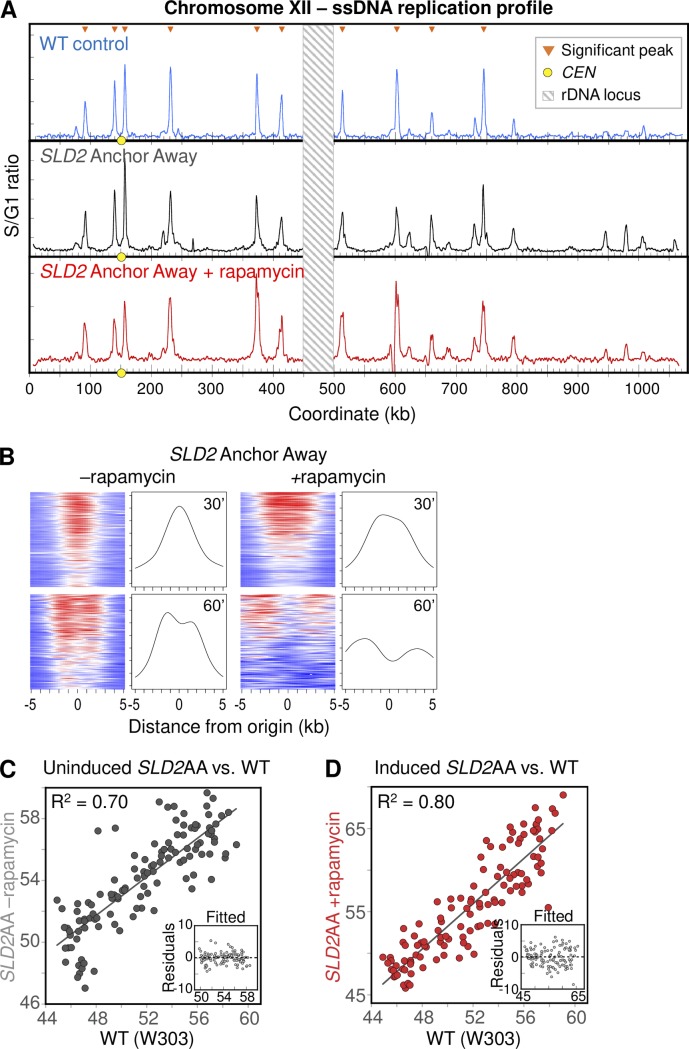
Fig 7. ssDNA replication profiling of SLD2 Anchor Away cells.
(A) Chr XII replication profiles for WT T30 (blue), uninduced SLD2 Anchor Away T30 (black), and induced SLD2 Anchor Away T30 (red). The WT profile is the same as in S8 Fig. Orange triangles mark significant peaks. Yellow dots on the X axis mark the centromere. Values at the rDNA locus (striped box at coordinates 450–500 kb) are excluded because of low probe density on the microarrays. (B) “Tornado” heat maps and mean ssDNA values showing origin activity and fork migration from the 117 significant origin peaks in control (left) and rapamycin-treated (right) in SLD2 Anchor Away cells. See Fig 6 legend and Materials and Methods for details. (C and D) Peak area correlation for control (uninduced; C) and rapamycin-treated (induced, D) SLD2 Anchor Away, respectively, with wild type. All samples were collected at 30 min. Insets show residuals from the linear fit model as in Fig 6.

