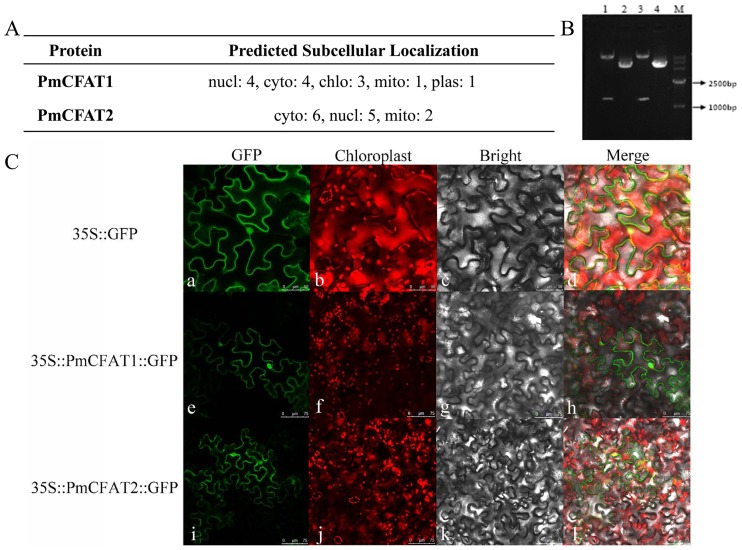
Fig 6. Subcellular localization analyses of PmCFAT1 and PmCFAT2.
(A) Prediction of protein subcellular localization of PmCFATs with WoLF PSORT Server. Note: nucl represents nucleus; cyto represents cytoplasm; mito represents mitochondria; plas represents plasma membrane; chlo represents chloroplast. (B) Restriction enzyme digestion of pSuper1300-GFP-PmCFATs. M: DL 15,000 Marker; 1 and 3 represent the enzyme digestion products of pSuper1300::PmCFAT1::GFP and pSuper1300::PmCFAT2::GFP, respectively; 2 and 4 represent circular plasmids of pSuper1300::PmCFAT1::GFP and pSuper1300::PmCFAT2::GFP, respectively, as controls. (C) Subcellular localization of PmCFAT1 and PmCFAT2. The fusion proteins were observed under a confocal laser scanning microscope. a, e, i show the green fluorescence channel; b, f, j show the chloroplast autofluorescence channel. c, g and k show the bright field channel; d, h and l were created from the images shown in the first two panels. a-d: bar = 10 μm; e-l: bar = 15 μm.

