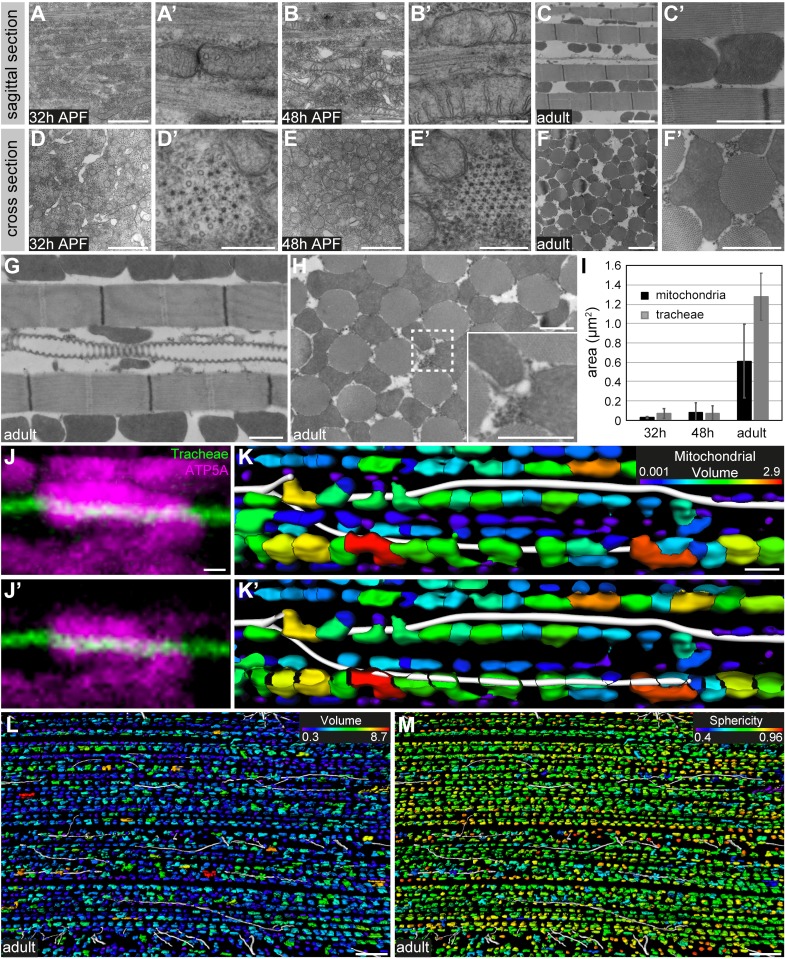
(A–H) Transmission electron micrographs of sagittal (A–C’,G) and cross-sections (D–F’,H) of DLMs at 32 hr APF (A–D’), 48 hr APF (B–E’) and in adult flies (C–F’). Note that mitochondrial morphology changes from elongated-tubular (48 hr APF) to globular shape in the adult. Cristae become increasingly elaborated as IFM development proceeds (compare A’,B’ to C’). (G,H) Tracheoles are closely associated with mitochondria. The region marked by a dashed line in H) is shown as a close-up (inset). (I) Analysis of the cross-sectional area (in µm2) of mitochondria (black bars) and tracheal lumen (gray bars), respectively, at 32 hr APF, 48 hr APF, and in adult flies. (J,J’) show two consecutive confocal sections demonstrating partial enclosure of a tracheole (autofluorescence in green) by a mitochondrium labeled with anti-ATP5A antibody (magenta). Images were acquired using the Airyscan detector (LSM880) followed by Airyscan processing. (K,K’) Segmentation of tracheal branches (white) and mitochondria (color-coded for volume) in a myotube. (J) shows a projection of the entire z-stack, (J’) shows a projection starting from the plane with the tracheole. Note that mitochondria partially enwrap tracheoles. (L,M) Color-coding of mitochondria for volume (L) or sphericity (M) shows that mitochondria in proximity to tracheal branches do not differ in volume or morphology from mitochondria more distant to tracheal branches. Scale bars: 1 μm (A,B,C’,D,E,F’,G,H), 200 nm (A’,B’D’,E’), 2 μm (C,F), 0.4 μm (J,J’), 2 µm (K,K’), 10 µm (L,M).


