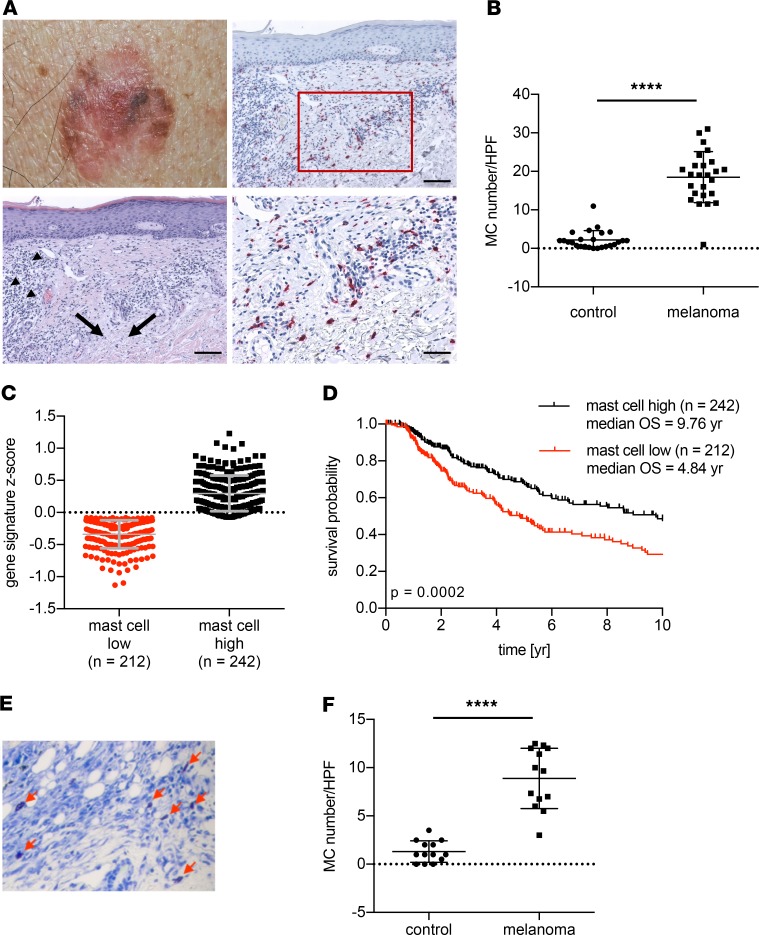
Figure 3. Mast cell accumulation adjacent to melanomas.
(A) Representative photomicrograph of a human melanoma with spontaneous immune regression (upper left) and histological sections thereof. Lower left: H&E staining of melanoma regression area with infiltrating lymphocytes and fibrosis as indicated by arrowheads and arrows, respectively (scale bar: 100 μm). Upper right: immunohistochemistry identifying MCs with antitryptase antibody (red stain; scale bar: 100 μm) and magnification thereof as indicated by a rectangle (lower right, scale bar: 50 μm). (B) Numbers of MCs within the melanoma immune regression area compared with MCs in control healthy skin regions at the rim of the excised margins. MC numbers/high-power field (HPF) are shown; n = 25; Wilcoxon’s test was used for P value calculation. (C) MC signature Z scores of 452 patients with melanoma derived from the TCGA data set as dichotomized values and (D) in correlation with overall survival data of the patients. (E) Representative example of toluidine blue–stained sections of mouse B16-OVA melanoma (arrows refer to MCs) and (F) MC quantification (MC numbers/HPF). Statistical difference was determined by paired t test (n = 13). ****P < 0.0001.

