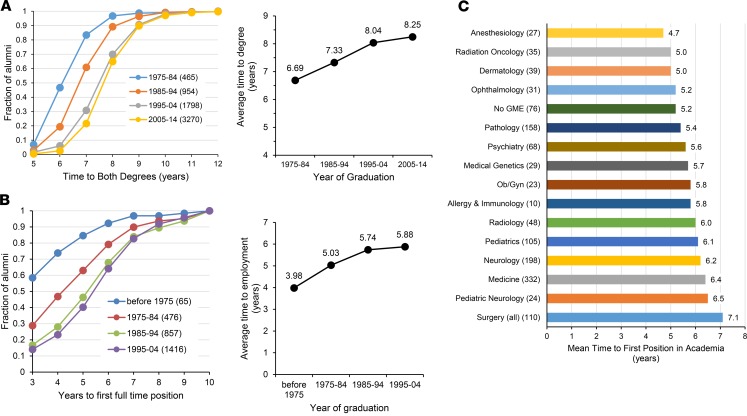
Figure 5. Time to degree and time to first full-time job.
(A) (Left) Fraction of graduates who completed both degrees in the number of years indicated on the x axis as a function of decade of graduation for all survey responders. The number of individuals in each cohort is listed in parentheses in the chart legend. (Right) The average time to degree in each of the graduation cohorts shown. By 1-way ANOVA using Tukey’s multiple comparisons test, all data points are significantly different from each other (P < 0.001). (B) (Left) Time to first full-time job after completion of postgraduate training for survey responders whose first position was in either academia full-time, the NIH (or other federal agency), the pharmaceutical or biotech industries, or nongovernmental research institutes expressed as the fraction of alumni at each time. The number of individuals in each cohort is listed in parentheses in the chart legend. (B) (Right) The average time to employment in each of the graduation cohorts shown. Data for the cohort graduating between 2005–2014 were not included in this analysis because most of them were still in postgraduate training. By 1-way ANOVA using Tukey’s multiple comparisons test, all of the data points are significantly different from each other; however, 1985–1994 is not significantly different from 1995–2004. (C) Mean time to first job for the 1,294 individuals who graduated between 1995–2004 with a first position in academia full-time as a function of GME specialty. The specialties are rank ordered by average time to first job.

