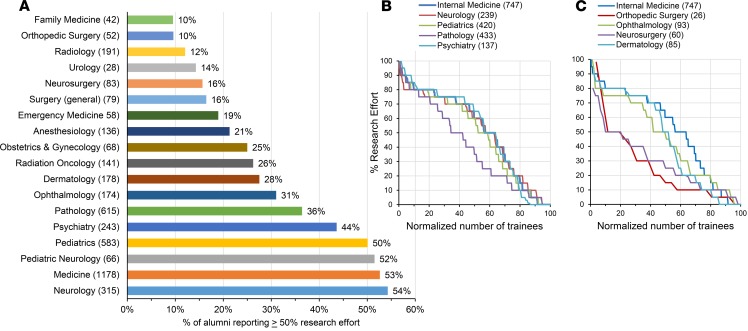
Figure 6. Medical specialty choice and research effort.
(A) Percent of all survey responders out of training who reported ≥ 50% research effort as a function of GME specialty. The number of alumni training in the specialty are indicated in parentheses next to the specialty, and the percentage reporting ≥ 50% research effort is indicated to the right of each bar. (B and C) Reported research effort as a function of GME specialty choice. Alumni are rank ordered from greatest reported percent research effort to least. The x axis has been normalized by the number of alumni to allow comparisons between specialties that vary considerably in the number of alumni in each (n values are in parentheses). P values derived by 1-way ANOVA with Dunnett’s multiple comparisons test indicate that orthopedic surgery (P < 0.0001), ophthalmology (P = 0.0301), neurosurgery (P < 0.0001), and pathology (P < 0.0001) are significantly different from internal medicine, while neurology (P = 0.7778), pediatrics (P = 0.1550), psychiatry (P = 0.9882), and dermatology (P = 0.0533) are not.

