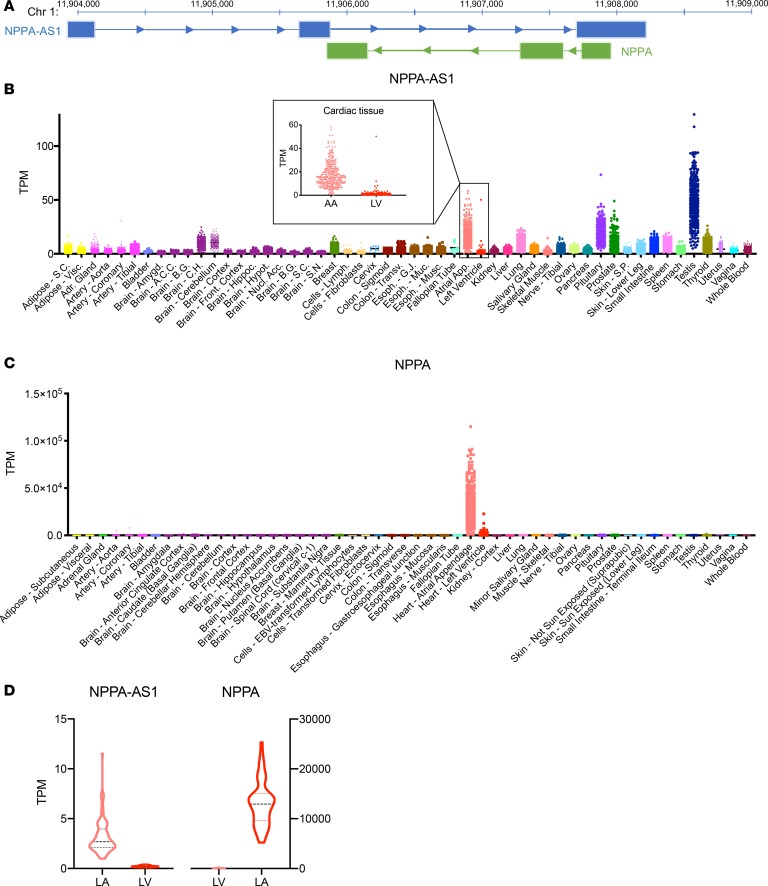
Figure 1. Tissue distribution of NPPA-AS1.
(A) Schematic overview of the NPPA/NPPA-AS1 locus. Arrows indicate direction of transcription. Chromosomal position is indicated at the top (GRCh37/hg19 genome assembly). Expression of NPPA-AS1 (B) and NPPA (C) across 53 different human tissues based on RNA-Seq data from the GTEx database (v. 7). Cardiac tissues are highlighted. TPM, transcripts per million reads. (D) Expression of NPPA and NPPA-AS1 in left ventricular (LV, n = 22) and left atrial (LA, n = 101) tissue based on RNA-Seq data from the Myocardial Applied Genomics Network. FPKM, fragments per kilobase million.

