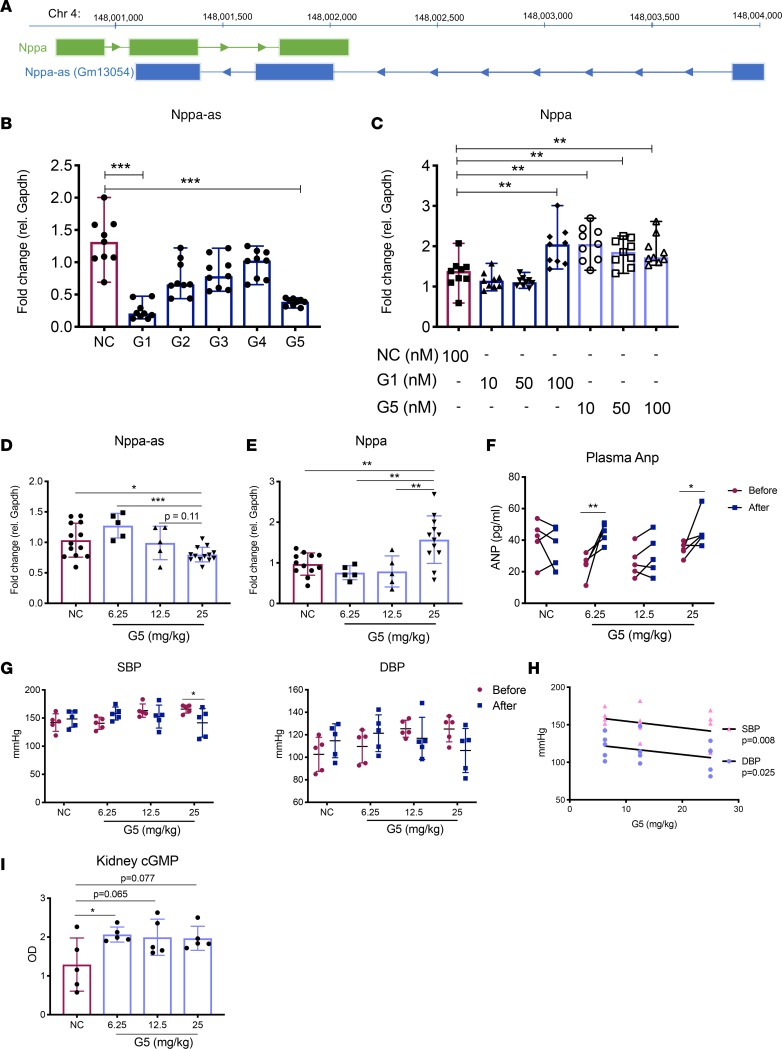
Figure 8. Knockdown of Nppa-as increases Nppa levels in vitro and in vivo.
(A) Schematic overview of the Nppa locus, including the natural antisense transcript Gm13054 on chromosome 4 (GRCm38/mm10 assembly). Arrows indicate direction of transcription. (B) Nppa-as and (C) Nppa expression in HL-1 cells transfected with different GapmeR designs and negative control, as measured by qRT-PCR. Expression is presented relative to Gapdh and normalized to the mean of the control group. Results are based on 3 separate experiments with 3 replicates in each group. Kruskal-Wallis was used to test the effect of each GapmeR design compared to the negative control. ***P < 0.001, **P < 0.01 after adjustment for multiple comparisons using Dunn’s test. (D) Nppa-as and (E) Nppa expression in atrial tissue of mice injected subcutaneously with 6.25, 12.5, or 25 mg/kg of GapmeR5 or 25 mg/kg of negative control GapmeR for 48 hours (n = 5–13 per group). Kruskal-Wallis was used to test the difference between animals treated with negative control and each of the G5 doses, as well as within G5 treatment groups. ***P < 0.001, *P < 0.05 after adjusting for multiple comparisons using Dunn’s test. (F) Plasma concentration of Anp in the saphenous vein of mice before and 48 hours after injection of the different Gapmer5 doses or 25 mg/kg of negative control GapmeR, as measured by ELISA (n = 5–13 per group). Repeated-measures 2-way ANOVA was used to test the difference before and after treatment in each group. *P < 0.05, **P < 0.01 after adjusting for multiple comparisons using Dunn’s test. (G) Systolic (SBP) and diastolic blood pressure (DBP) in mice before and 48 hours after GapmeR injections measured using a noninvasive tail cuff method (n = 5/group). Repeated-measures 2-way ANOVA was used to test for differences within groups. *P < 0.05 after adjusting for multiple comparisons using Dunn’s test. (H) Correlation of G5 dose with SBP and DBP in treated animals. Pearson’s correlation coefficient and P value are shown. (I) Kidney cGMP in each treatment group (n = 5/group) as measured by ELISA. Kruskal-Wallis was used to test the effect of each of the G5 doses compared to negative control GapmeR. *P < 0.05 after adjustment for multiple comparisons using Dunn’s test. For all graphs, mean and standard deviation are shown.

