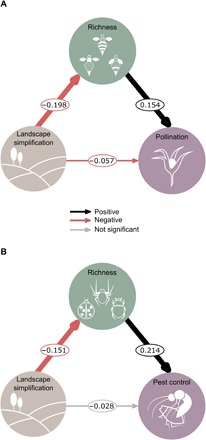
Fig. 3. Direct and indirect effects of landscape simplification on richness of service-providing organisms and associated ecosystem services.

(A) Path model of landscape simplification as a predictor of pollination, mediated by pollinator richness (n = 821 fields of 52 studies). (B) Path model of landscape simplification as a predictor of pest control, mediated by natural enemy richness (n = 654 fields of 37 studies). Path coefficients are effect sizes estimated from the median of the posterior distribution of the model. Black and red arrows represent positive and negative effects, respectively. Arrow widths are proportional to HDIs. Gray arrows represent nonsignificant effects (HDIs overlapped zero).
