
Fig. 4. Parental chromosome segregation can be nonrandom during tripolar mitosis and generates 2n cells with only one parental genome.
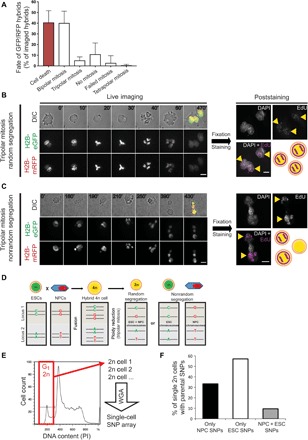
(A) Quantification of the hybrids’ fate after cell fusion (N = 201 cells, six independent fusion experiments; mean ± SD). (B and C) Representative time-lapse (left) and poststaining images (right) of tripolar mitosis with random (B) or nonrandom (C) chromosome segregation. Merged images correspond to the last frame of the respective time-lapse (time progression in minutes is shown on each frame). Yellow arrowheads indicate EdU-positive cells (pseudocolored magenta) after staining. Scale bars, 10 μm. (D) Schematic representation of two genomic loci carrying different single-nucleotide polymorphisms (SNPs) in ESC (green) and NPC (red). After ploidy reduction, 2n cells can carry one allele from each parental cell or both alleles from only one parental cell. 2n cells derived from nonrandom chromosome segregation during tripolar mitosis include informative SNPs identical to the ones carried by the parental cells. (E) Cell cycle profile of a representative mixed clone from which G1-2n cells (red box) were individually sorted for single-cell SNP genotyping. WGA, whole genome amplification. (F) Percentage of single G1-2n cells that exclusively contain NPC SNPs, ESC SNPs, or mixed SNPs (black, white, and gray bars, respectively) (N = 21 single cells sorted from four different mixed clones; see fig. S4K for SNP percentages of individual cells).