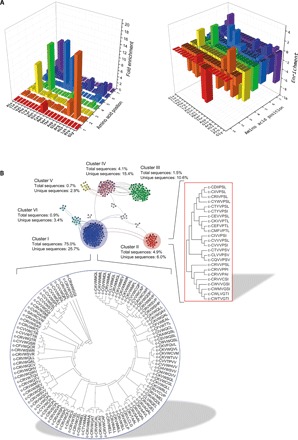
Fig. 3. Sequence analysis of the selected cyclic heptapeptide pool.

(A) Left: Frequency of appearance of the 20 natural amino acids at each position of the heptapeptide sequences selected after the seventh round of sorting (Fig. 2B). Right: Enrichment of the 20 natural amino acids at each position of the heptapeptide sequences selected after the seventh round of sorting (Fig. 2B). Values represent the log2-fold change of the amino acid frequency of appearance of the peptides from the sorted pool compared to the initial library. (B) Visualization of the main clusters formed by the selected cyclic heptapeptides according to their sequence similarities. Nodes represent different cyclic peptide sequences, and solid lines connect pairs of peptides that share at least 70% sequence identity. The sequences of the members of the two most dominant clusters (clusters I and II) are shown in the corresponding dendrograms.
