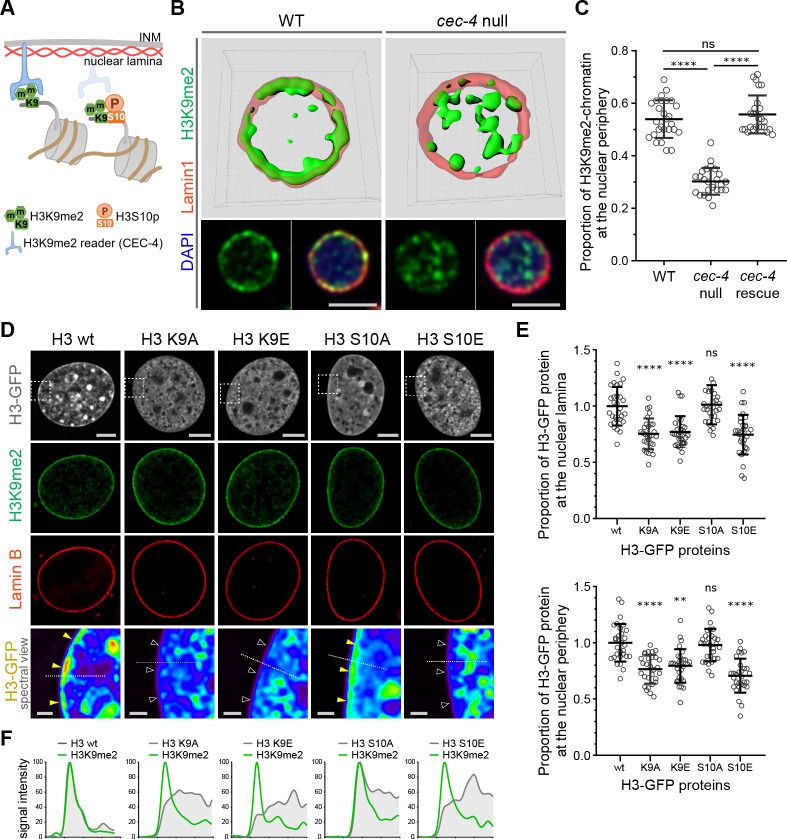
Figure 3. H3K9me2 is essential for histone H3 positioning at the nuclear periphery.
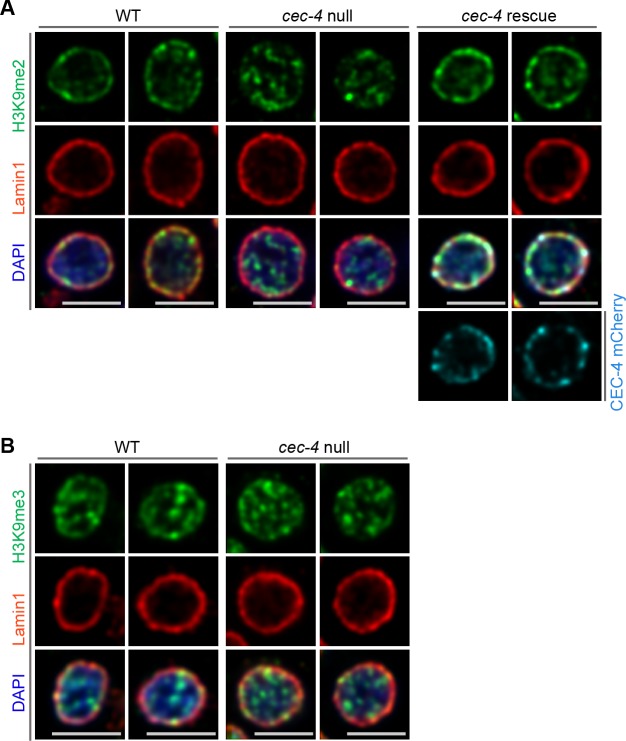
(A) Schematic illustrating C. elegans protein CEC-4 tethering H3K9me2-marked chromatin to the nuclear periphery; INM: inner nuclear membrane. (B) Localization of H3K9me2-marked chromatin (green) in wild-type (WT) and cec-4-null C. elegans embryo cells, counterstained with nuclear lamina marker Lamin 1 (red) and DAPI (blue); 3D reconstruction (top); immunofluorescent confocal images of C. elegans embryo cells (bottom). Scale bars: 3 μm (C) Dot plot of the proportion of total H3K9me2-marked chromatin at the nuclear lamina in WT, cec-4-null, and cec-4-rescued embryo cells (mean ± SD); n = 25 cells per condition. (D) Localization of indicated histone H3-GFP fusion proteins in NIH/3T3 cells; counterstained with H3K9me2 (green) and nuclear lamina marker Lamin B (red); spectral views (magnifications of top panels as indicated by dashed squares) illustrate H3-GFP signal intensity. Localization of the H3-GFP at the nuclear periphery (yellow arrowheads) or loss of peripheral localization (white arrowheads). Scale bars: 5 μm (top panels) and 1 μm (bottom panels). (E) Dot plot of the proportion of indicated H3-GFP fusion protein at the nuclear lamina (marked by Lamin B, top) or within the layer of peripheral heterochromatin (marked by H3K9me2, bottom), normalized to wt H3-GFP, calculated using Lamin B or H3K9me2 signal as a mask (mean ± SD); n = 30 cells per condition. (F) Line signal intensity profiles of corresponding images in panel D indicated by dashed lines. Statistical analyses performed using two-tailed student’s t-test for panel C and one-way ANOVA test for panel E; ****p<0.0001, **p=0.0024, ns: not significant; all comparisons relative to wild type (wt).


