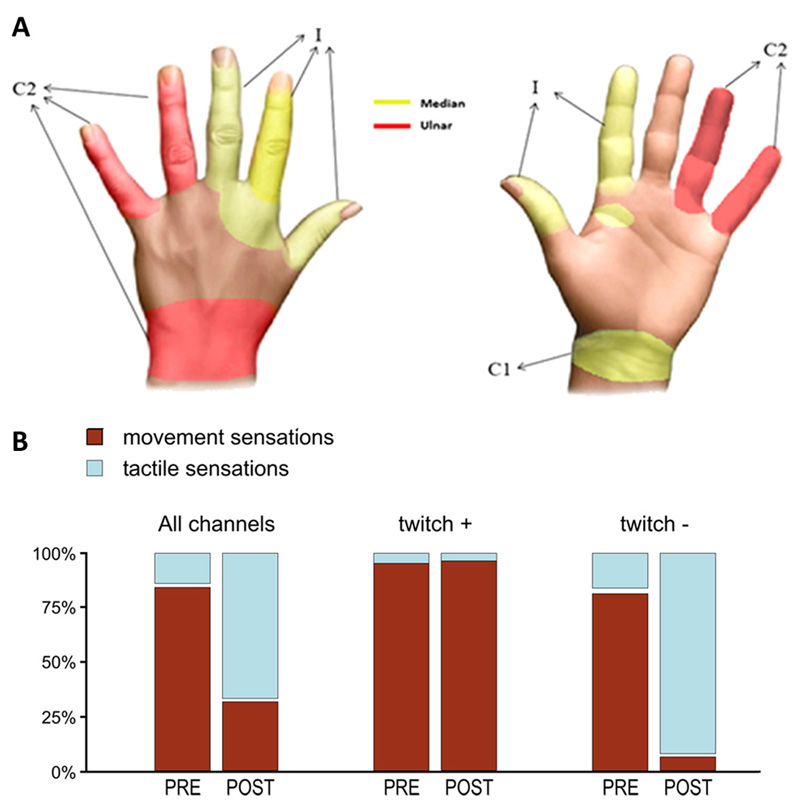
Figure 7. Sensation locations and quality over time.
(A) The three electrodes elicited sensations in 13 different locations of the hand on anterior and posterior parts of the hand. Red areas refer to sensations evoked stimulating the ulnar nerve, while yellow represents territories elicited by stimulation on the median nerve. C1 indicates region elicited with cuff electrode on median nerve, C2 refers to cuff on ulnar nerve and I indicates the intraneural electrode in the median nerve. (B) Modification of the elicited sensations for the intraneural electrode on the median nerve. Up to time T0 (i.e. PRE) most of the elicited sensations evoked movement (brown); after T0 (i.e. POST) most of the elicited sensation evoked touch (blue). In separate series, histograms represent the cumulative percentage of stimulated contacts, considering all contacts, contacts evoking EMG activity (twitch +) and contacts evoking no EMG activity (twitch -).

