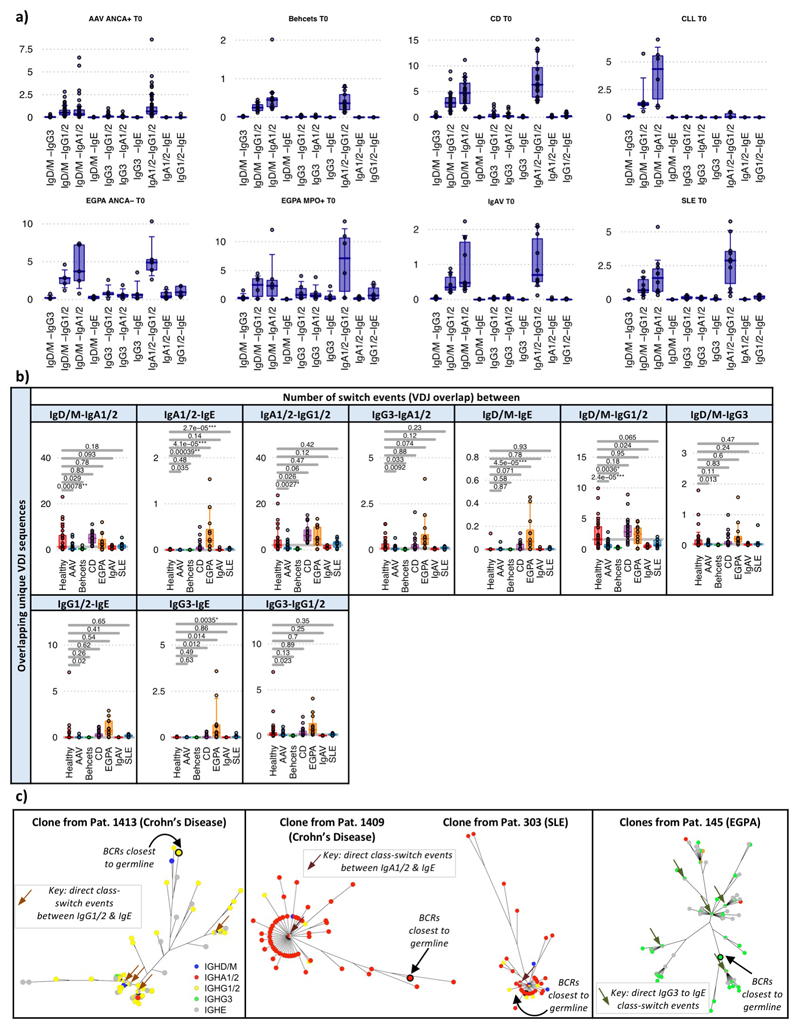
Extended Data Figure 8. Class-switch recombination estimation differences between diseases.
a) Boxplots of the proportion of class-switch events between isotypes for each autoimmune disease. Boxplots show the 25th, 50th and 75th percentiles; whiskers show upper and lower quartiles. b) Boxplots of the proportion of class-switch events between autoimmune diseases across isotypes for PBMC BCR repertoires via subsampling total repertoire. P-values calculated by two-sided ANOVA and * denotes FDR <0.05, ** <0.005, *** <0.0005, where FDR was determined by the Šidák method. n=32, 18, 32, 12, 10, 23, 10 and 13 for healthy, AAV MP0+, AAV PR3+, EGPA, SLE, CD IgAV and Behçet’s patients respectively. Boxplots show the 25th, 50th and 75th percentiles; whiskers show upper and lower quartiles. c) Phylogenetic trees of representative clonal expansions from patients demonstrating class-switch recombination events. Each vertex is a unique BCR sequence and is represented by a pie chart indicating the percentage of each isotype, where blue = IgD/M, red = IgA1/2, yellow = IgG1/2, green = IgG3, and grey = IgE. Branch lengths are estimated by maximum parsimony, and the BCRs with the lowest number of somatic hypermutations are indicated (denoted “BCRs closest to germline”).

