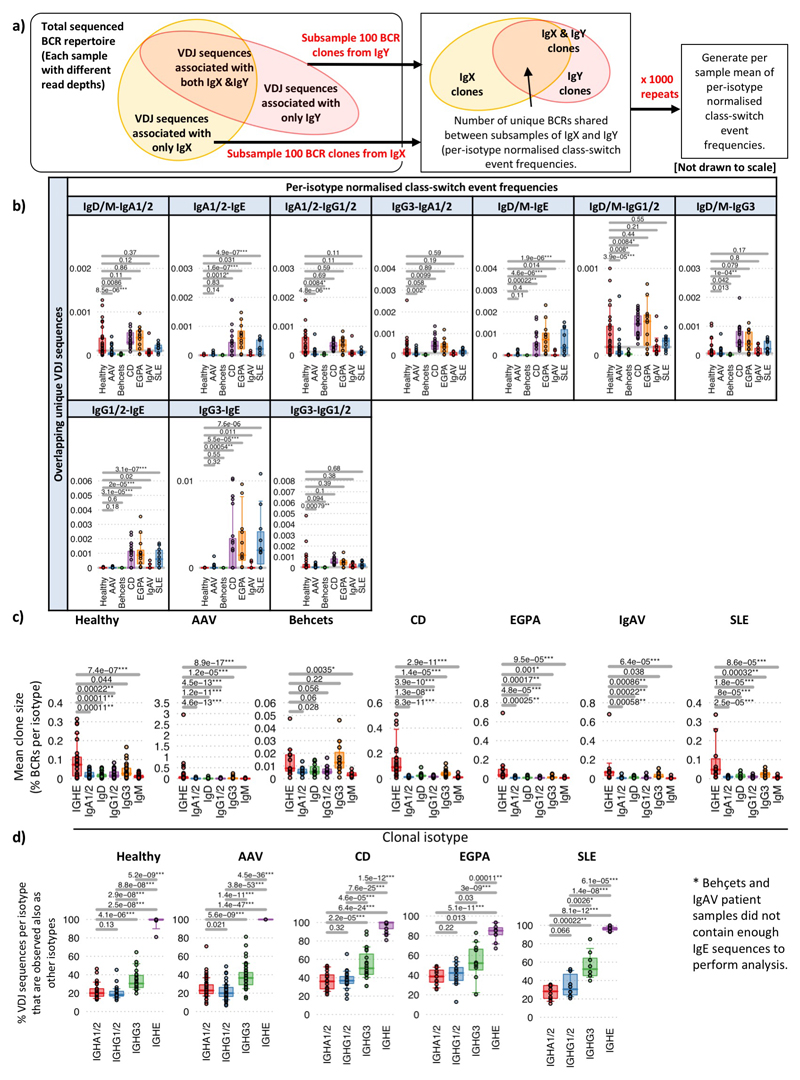
Extended Data Figure 9. Normalised class-switch recombination estimation differences between diseases and IgE clonal features.
a) Schematic diagram of sub-sampling of BCR repertoires to generate the per-isotype normalized class-switch event frequencies, defined as the frequency of unique VDJ regions expressed as two isotypes whilst normalizing for differences in isotype frequencies. To account for differences in isotype proportions, BCRs from each isotype were randomly subsampled to a fixed depth of 200 reads, and the proportion of unique VDJ sequences present between each pair of isotypes was counted. The mean of 1000 repeats was generated. b) Boxplots of the proportion of the per-isotype normalized class-switch event frequencies between isotypes for each autoimmune disease. P-values calculated by two-sided by ANOVA and * denotes FDR <0.05, ** <0.005, *** <0.0005, where FDR determined by Šidák method. n=32, 18, 32, 12, 10, 23, 10 and 13 for healthy, AAV MP0+, AAV PR3+, EGPA, SLE, CD IgAV and Behçet’s patients respectively. Boxplots show the 25th, 50th and 75th percentiles; whiskers show upper and lower quartiles. c) Boxplots of the mean cluster sizes per patient per isotype as a percentage of BCRs per isotype, comparing IgE-associated clones with non-IgE-associated clones for each disease. d) The proportion of VDJ sequences per isotype that are observed also as other isotypes for each disease. P-values calculated by two-sided Wilcoxon tests and * denotes FDR <0.05, ** <0.005, *** <0.0005, where FDR determined by Šidák method. n=32, 18, 32, 12, 10, 23, 10 and 13 for healthy, AAV MP0+, AAV PR3+, EGPA, SLE, CD IgAV and Behçet’s patients respectively. Boxplots show the 25th, 50th and 75th percentiles; whiskers show upper and lower quartiles.

