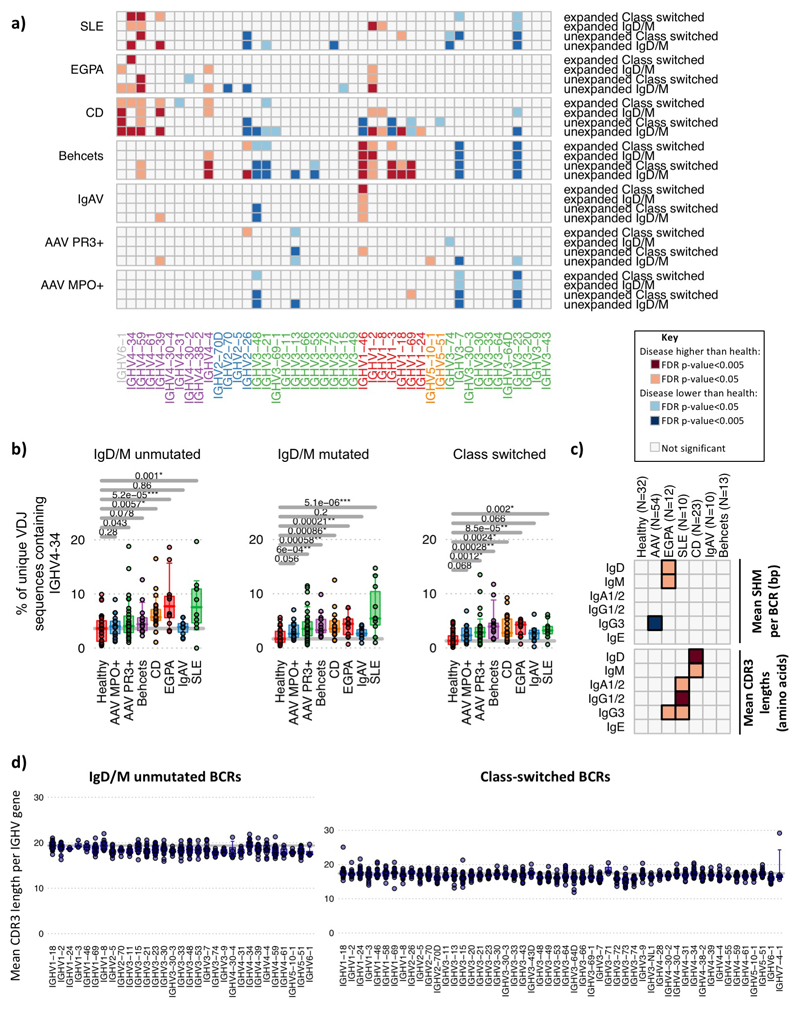
Extended Data Figure 4. Changes in IGHV gene usage with disease.
Changes in IGHV gene usage between unexpanded and expanded clones. a) Heatmap of each IGHV gene frequency difference between healthy individuals and each autoimmune disease patient group within BCRs from IgM+D+ or isotype-switched (IgA/IgG/E) BCR from unexpanded clones (clontaining <3 unique BCRs) or expanded clones (3 or more unique BCRs per clone). Only genes >0.1% in frequency are shown. IGHV genes are ordered according to amino acid similarity as in Figure 2. b) IGHV4-34 BCR frequencies with autoreactive AVY & NHS motifs compared between healthy individuals and disease groups, separated by BCR type: IgM+D+SHM- BCR sequences, IgM+D+SHM+ BCR sequences and IgM-D- BCR sequences (defined in (a)). c) Heatmaps showing the (top) mean SHM per BCR and (bottom) relative mean CDR3 lengths mean SHM per BCR per isotype per disease from total PBMC B cells. d) The distribution of the mean CDR3 lengths per IGHV gene in healthy individuals (n=32). Each point represents a mean CDR3 length for an individual for (left) unmutated IgD/M BCRs and (right) class-switched BCRs. Instances where IGHV genes represented by fewer than 10 BCRs in an individual are excluded. For (a)-(d): n=32, 18, 32, 12, 10, 23, 10 and 13 for healthy, AAV MP0+, AAV PR3+, EGPA, SLE, CD IgAV and Behçet’s patients respectively. P-values calculated by two-sided ANOVA. Orange squares indicate significantly higher, and blue squares significantly lower, corresponding gene frequency between healthy individuals and disease. FDR determined by Šidák method.

