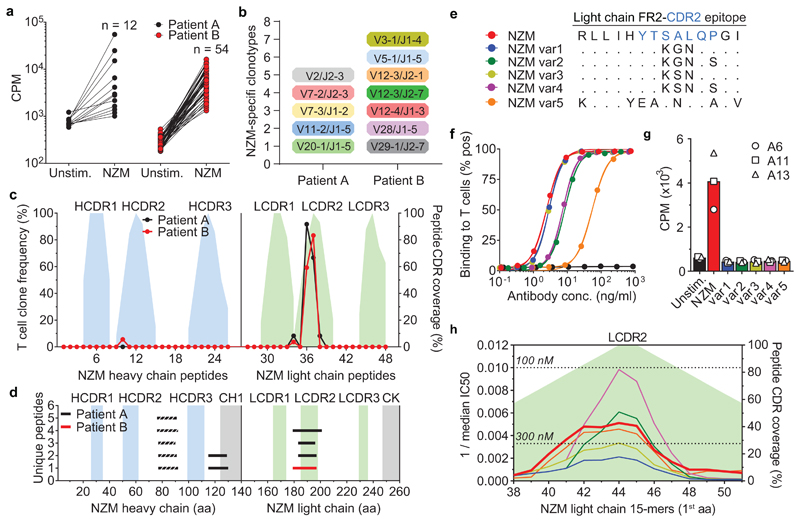
Fig. 4. Identification of a single immunodominant T cell epitope that can be engineered to deimmunize NZM.
a, Proliferative response of NZM-reactive T cell clones isolated after ex-vivo stimulation of memory CD4+ T cells, upon re-stimulation with the overlapping peptide pool covering the entire sequences of the variable regions of the NZM heavy and light chains. Proliferation was assessed on day 3 after 16 h pulse with [3H]-thymidine. Data are expressed as counts per minute (cpm). Unstim., unstimulated T cells. b, TCR Vβ gene repertoire of NZM-reactive CD4+ T cell clones isolated from MS patients A and B. The y-axis indicates the number of unique clonotypes identified. c, Epitope mapping of NZM-specific CD4+ T cell clones isolated from patients A and B. The epitopes were identified by screening the T cell clones with overlapping peptides spanning the NZM heavy and light chain variable region. The left y-axis indicates the frequency of T cell clones reactive to each peptide. The right y-axis indicates the percentage of CDR residues within each peptide shown as filled areas in the background (representative of n = 2 experiments). d, Mass spectrometry-based MHC peptidomics of NZM-specific B cell clones pulsed with NZM. Each line represents a unique MHC-II-bound peptide identified in n = 2 independent experiments. Dashed lines indicates peptides belonging to both NZM and B cell receptor of the antigen-presenting cells. The y-axis indicates the number of unique peptides overlapping in the same NZM region. e, Comparison of the amino acid sequences of the LCFR2-CDR2 epitope of NZM and the five variants engineered for the drug deimmunization. f, Binding of NZM variants to α4 integrin expressed on T cells analyzed by flow cytometry. The NZM variants are color coded as depicted in panel e. An antibody with different specificity was used a negative control (black curve). g, Proliferation of three NZM-LCFR2-CDR2-reactive T cell clones (A6, A11 and A13) after stimulation with autologous B cells pulsed with NZM and the five engineered variants (representative of n = 2 independent experiments). The bars show the mean proliferation. h, Predicted binding affinities of 15mer peptides spanning the light chain CDR2 region of NZM variants to a reference set of nine DRB1 and DRB3/4/5 alleles (DRB1*0301, DRB1*0701, DRB1*1301, DRB1*1401, DRB1*1501, DRB3*0101, DRB3*0202, DRB4*0101, DRB5*0101)15,16. The NZM variants are color coded as depicted in panel e. The affinities are shown as reciprocal median IC50 (nM) values. The dotted lines define the thresholds of high-affinity binding set at 100 nM and low-affinity binding set at 300 nM.

