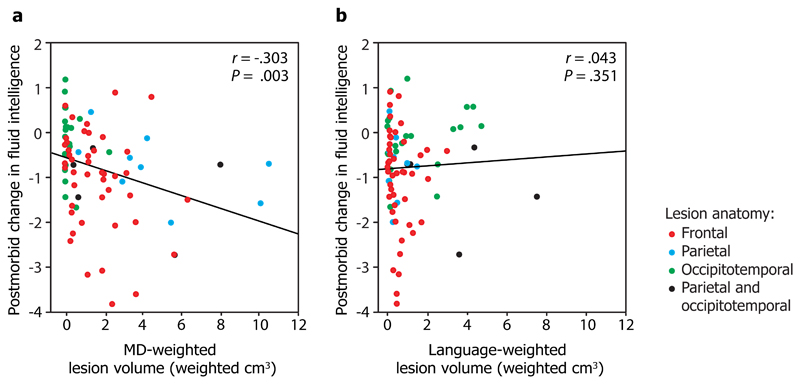
Figure 1. Correlation of a) MD-weighted lesion volume, and b) language-weighted lesion volume with postmorbid change in fluid intelligence.
For each patient (N=80), lesion volume was weighted for the extent of damage to the MD and language systems using probabilistic maps which indicate the likelihood that each voxel belongs to the MD and language systems in healthy participants. We estimated postmorbid change in fluid intelligence by comparing current function to estimated premorbid function (postmorbid minus premorbid: a negative score indicates a deficit). Point colour indicates lesion anatomy: frontal (red), parietal (blue), occipitotemporal (green), or parietal and occipitotemporal (black). r is Pearson’s correlation coefficient, P is the corresponding one-tailed P-value of the correlation. r, P, and fit lines are shown for the whole group. The extent to which lesions affect the MD, but not language, system predicts fluid intelligence deficit.

