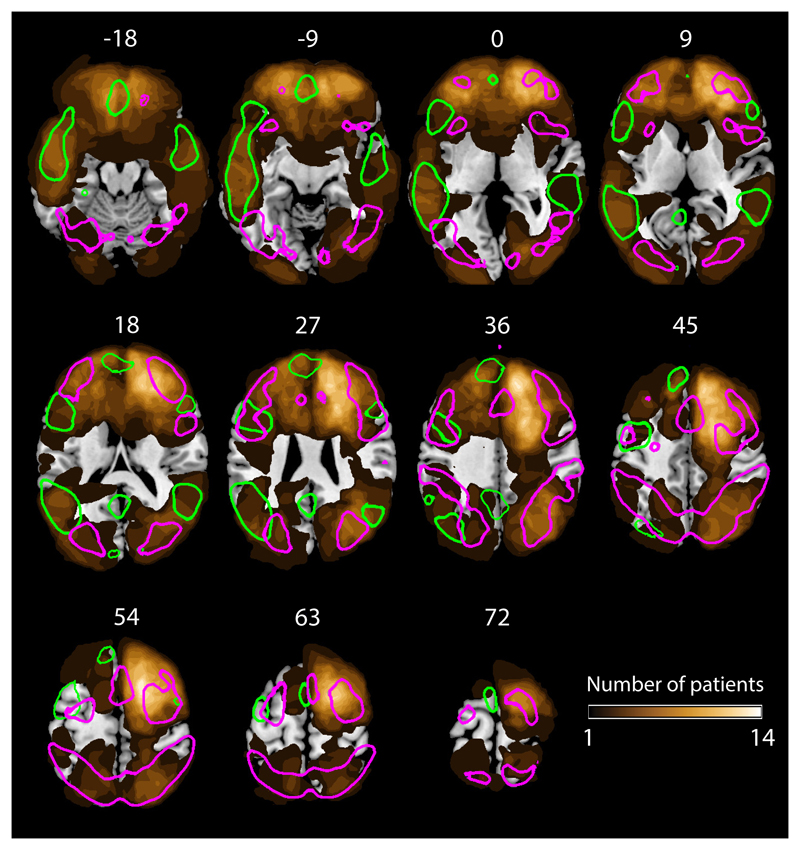
Figure 3. Anatomical distribution of lesions.
Gold colours indicate number of participants with a lesion at each voxel. Coloured outlines indicate regions of probability > 5% in the probabilistic MD (magenta, N = 63) and language (green, N = 220) maps which we used to derive MD and language weighted lesion volume. Our patient sample (N=80) provided good coverage of both the MD and language systems, with the exception of superior lateral regions of the left frontal cortex.

