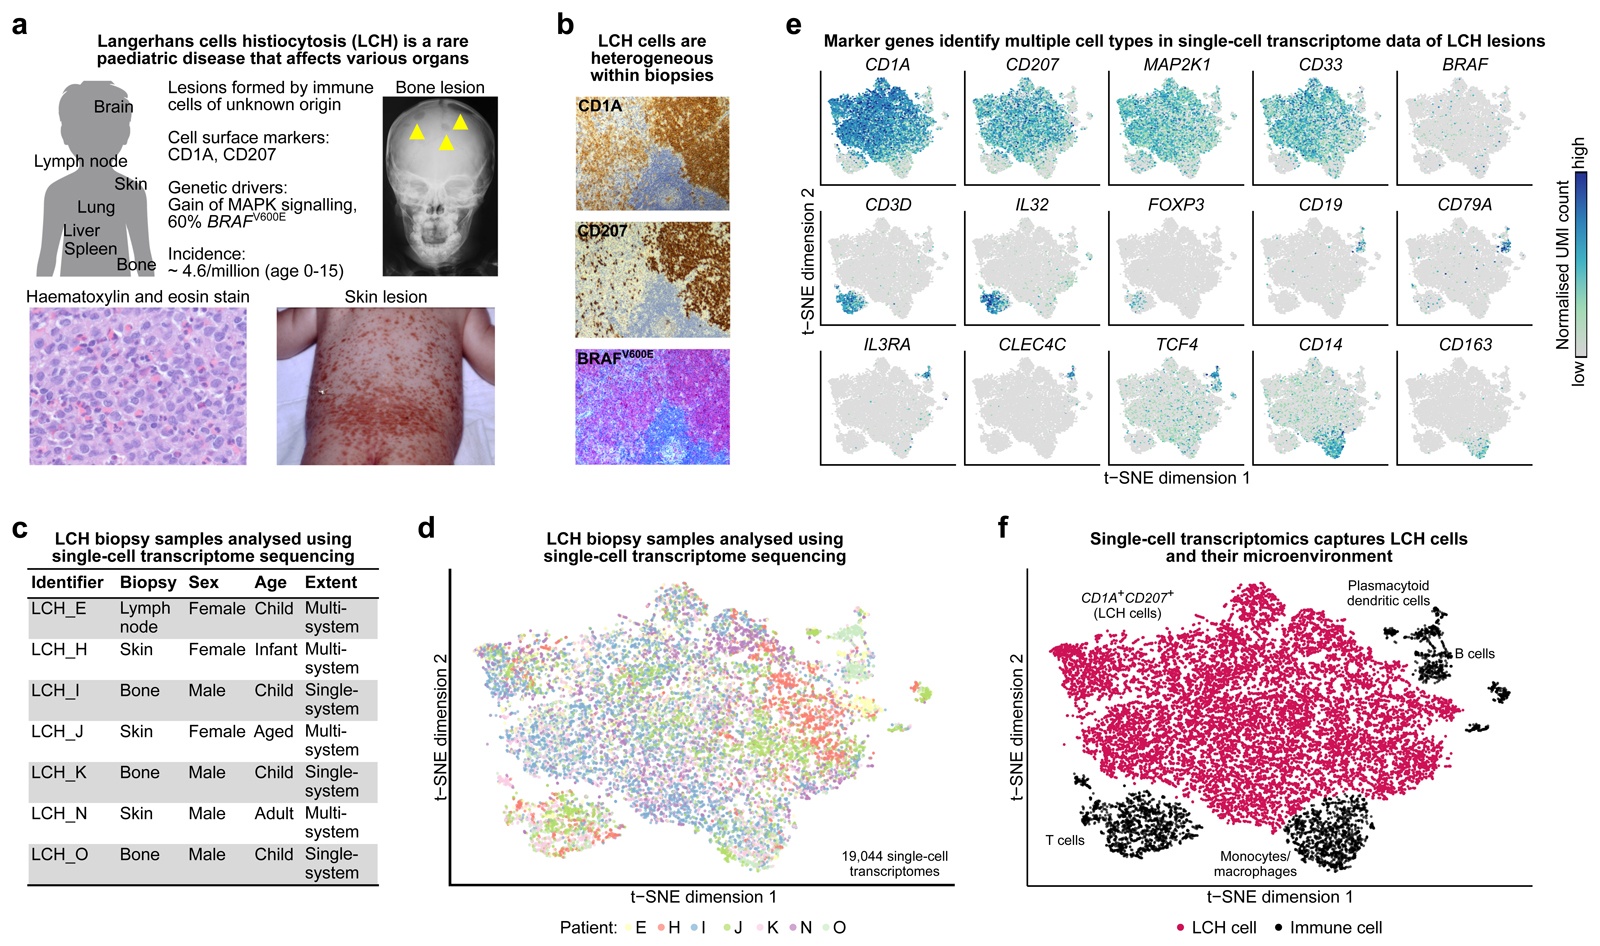
Figure 1. Single-cell transcriptome analysis captures cellular and molecular diversity of LCH lesions.
A) Clinical presentation and incidence2 of Langerhans cell histiocytosis (LCH). Shown are an x-ray image of LCH bone lesions in the skull (top right), a photography of extensive LCH skin lesions (bottom right), and a hematoxylin and eosin staining of an LCH biopsy (bottom left).
B) Cellular heterogeneity in an LCH biopsy (lymph node), as revealed by immunostaining for CD1A, CD207, and an antibody that specifically detects mutated BRAFV600E protein.
C) Overview the of patient biopsy samples analyzed by single-cell RNA-sequencing in this study.
D) Low-dimensional projection (t-SNE plot) of the combined single-cell RNA-seq dataset across all analyzed biopsies, comprising a total of 19,044 single-cell transcriptome profiles.
E) Molecular heterogeneity in LCH illustrated by low-dimensional projection (as in panel D) of all single-cell transcriptome profiles overlaid with the expression levels of selected marker genes (dark blue color indicates high expression levels).
F) Cellular heterogeneity in LCH illustrated by low-dimensional projection (as in panel D), annotated with cell types inferred from marker gene expression.

