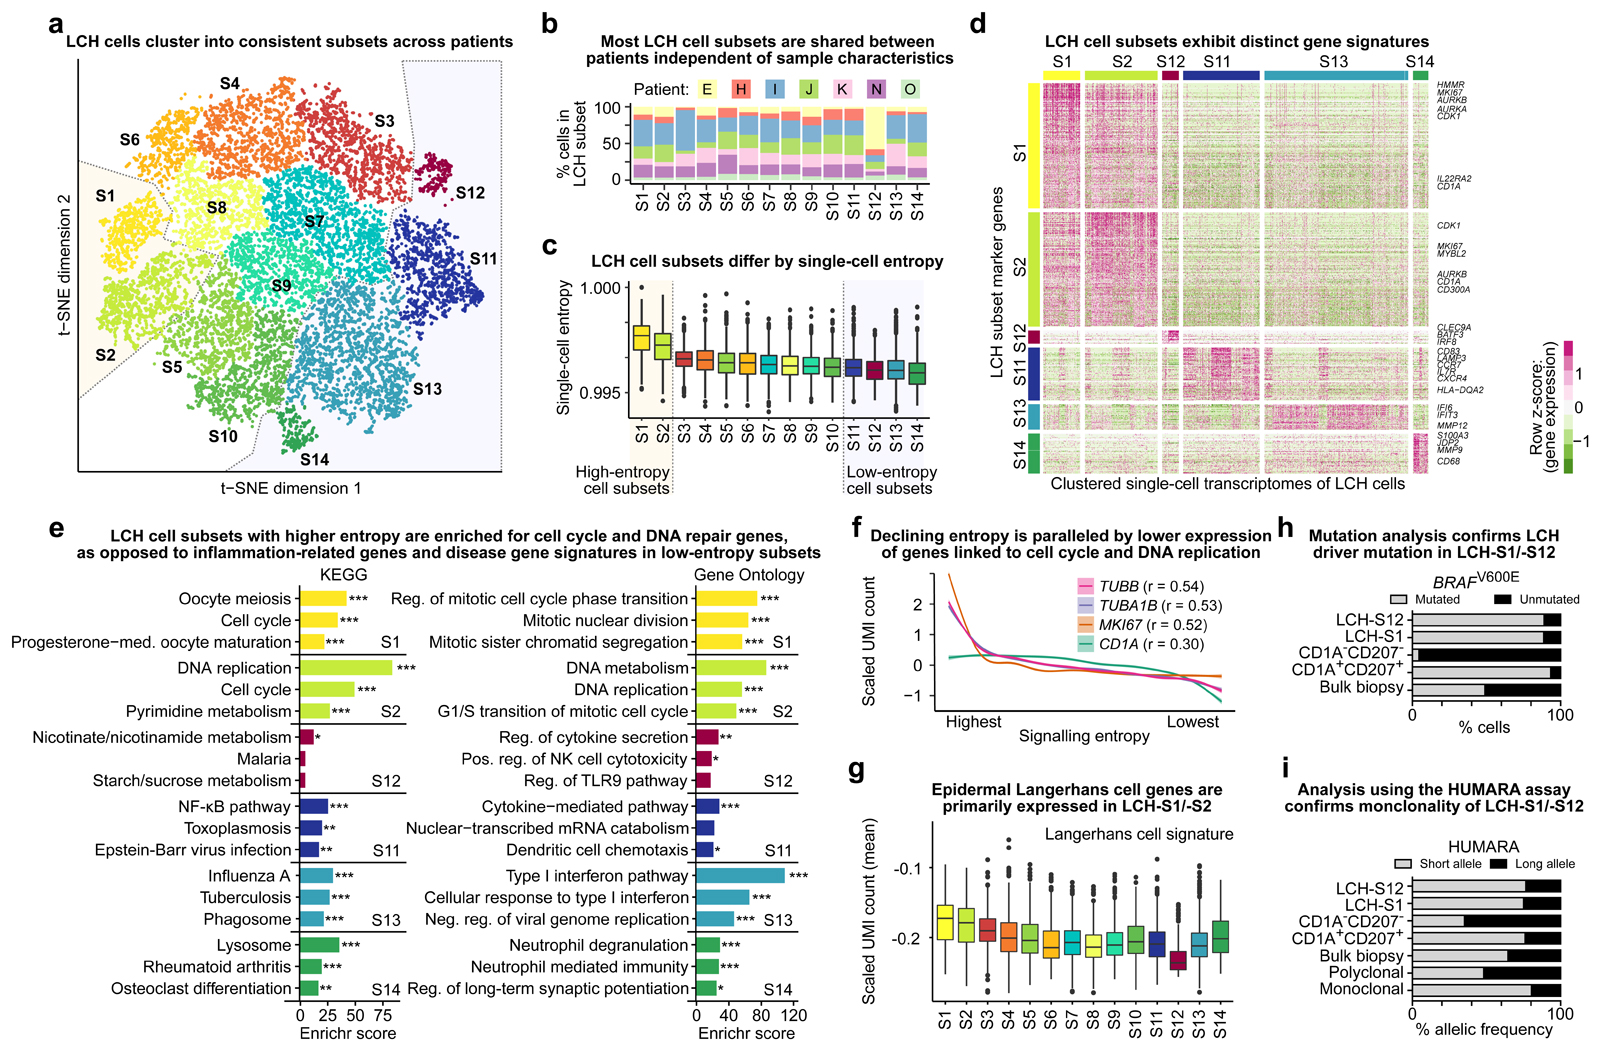
Figure 3. LCH lesions comprise proliferating LCH progenitors and multiple differentiated LCH cell subsets.
A) Low-dimensional projection (t-SNE plot) of LCH cell transcriptomes, excluding non-LCH immune cells. LCH cells were clustered into 14 subsets. Dashed lines highlight the putative progenitor cell subsets (LCH-C1, LCH-C2) and the most differentiated cell subsets (LCH-C11 to LCH-C14) based on the analysis of transcriptome entropy (panel C).
B) Percentage of cells assigned to each of the 14 LCH cell subset (from panel A) for each analyzed patient biopsy sample.
C) LCH cell subsets ordered by the median single-cell entropy of the corresponding single-cell transcriptomes. High entropy indicates promiscuity of gene expression, which has been described as a hallmark as undifferentiated cells. Dashed lines highlight the putative progenitor cell subsets (LCH-C1, LCH-C2) and the most differentiated cell subsets (LCH-C11 to LCH-C14) as in panel A.
D) Heatmap showing expression levels of differentially expressed genes between the two LCH subsets with highest entropy and the four subsets with lowest entropy. Selected hallmark genes are highlighted for each subset.
E) Enrichment analysis with Enrichr for the LCH subset signature genes (from panel D) using KEGG pathways and Gene Ontology, ordered by the Enrichr combined score. FDR-adjusted p-value: *, p < 0.1; **, p < 0.05; ***, p < 0.001. Further details are provided in Supplementary Table S3.
F) Smoothed line plots displaying the relation between decreasing entropy (x-axis; ranked) and the expression of selected genes. The cell cycle genes TUBB, TUBA1B, and MKI67 showed the highest Pearson correlation (r) between entropy and expression. A weaker correlation was found also between entropy and the expression of the canonical LCH marker gene CD1A.
G) Expression of genes characteristic of (non-LCH) epidermal Langerhans cells in each LCH cell subset, displaying the mean of the scaled UMI counts of all genes in the LCH subset signature.
H) Assessment of BRAFV600E mutation burden (in percent) based on allele-specific qPCR in sorted LCH-S12 cells, LCH-S1 cells, CD1A/CD207-negative (non-LCH) cells, CD1A/CD207-double-positive LCH cells, and bulk biopsy cells. All data refer to patient sample LCH_E.
I) Assessment of cell clonality using the HUMARA assay in the same sorted cell populations as in panel H, and in known polyclonal and monoclonal cell lines as negative and positive controls, respectively.

