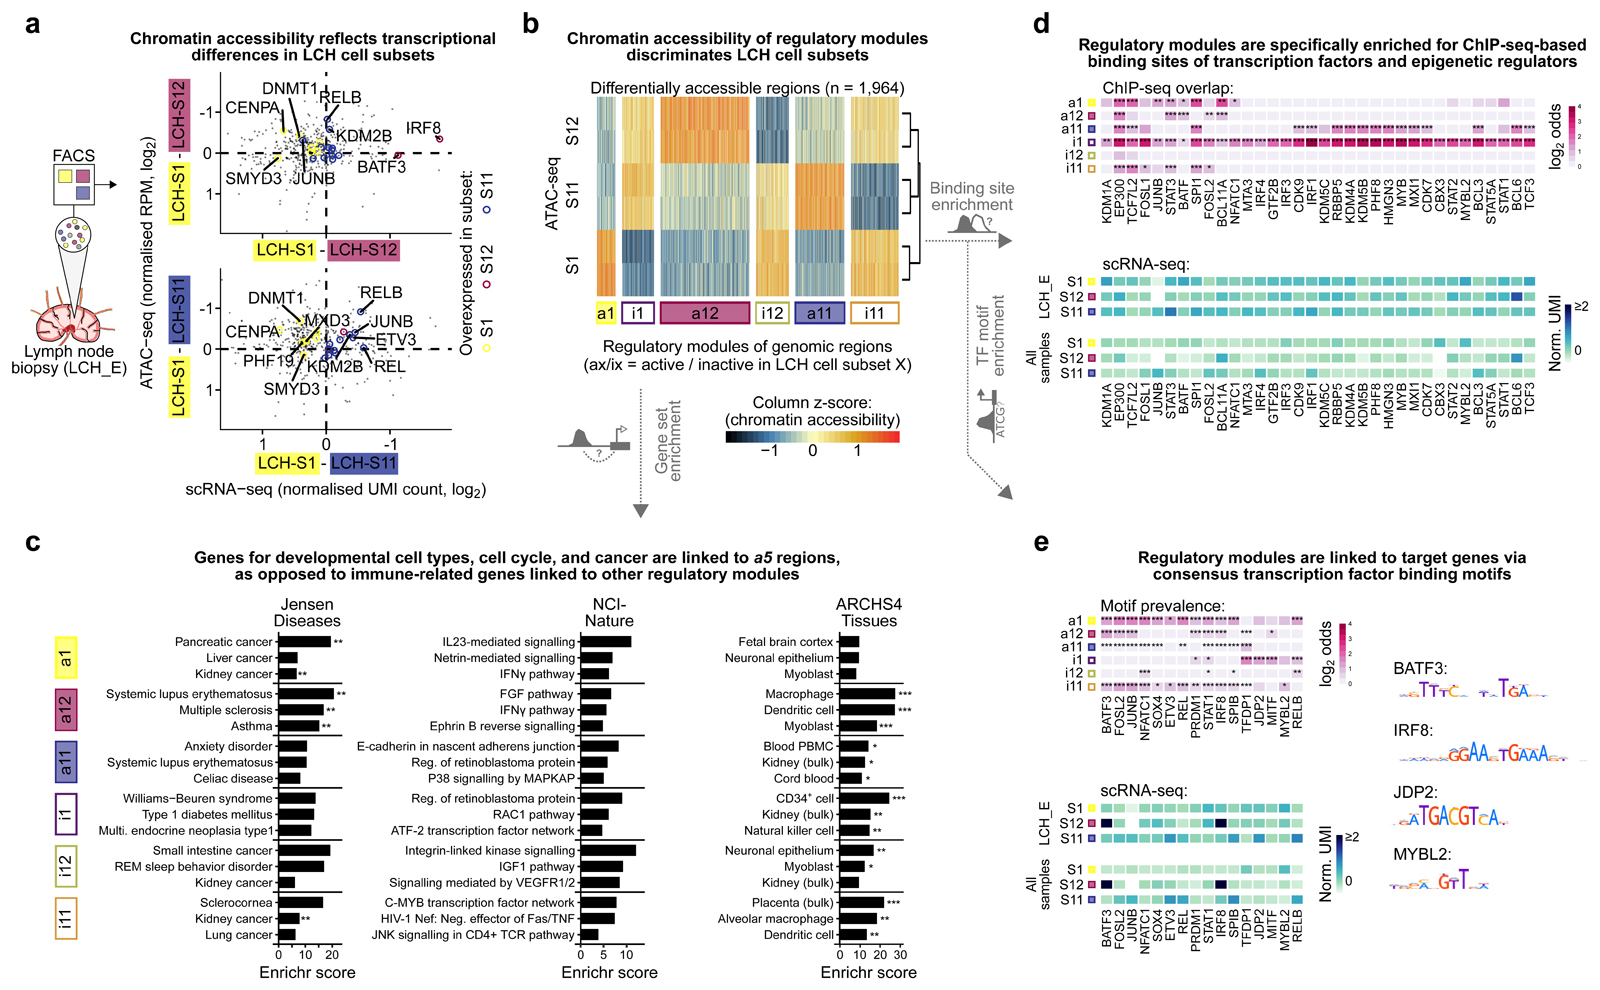
Figure 5. Characteristic patterns of chromatin accessibility distinguish between LCH cell subsets.
A) Scatterplots contrasting differential gene expression with differential chromatin accessibility between progenitor-like LCH-S1 cells and the more differentiated LCH subsets LCH-S12 (top) and LCH-S11 (bottom). The x-axis denotes differences in gene expression (mean normalized UMI count based on scRNA-seq) and the y-axis displays the mean difference in chromatin accessibility over all regulatory regions linked to the respective gene (mean of two replicates, mean normalized reads per million [RPM]). Colored points denote LCH-subset-specific marker genes (from Fig. 3D).
B) Heatmap showing ATAC-seq signal intensity for 1,964 differentially accessible regions identified in pair-wise comparisons of one LCH cell subset against the two other subsets. Regions are grouped into six modules based on differential chromatin accessibility. ATAC-seq signal intensity scores are scaled by column (ATAC-seq peaks) for better visualization of differences.
C) Enrichment analysis with Enrichr for genes linked to each of the six modules of LCH-subset-specific chromatin accessible regions, showing the top-3 most enriched terms ordered by the Enrichr combined score58. FDR-adjusted p-value: *, p < 0.1; **, p < 0.05. Further details are provided in Supplementary Table S3.
D) Heatmap of transcription factor binding enrichment for LCH-subset-specific modules, based on LOLA31 analysis using a large collection of ChIP-seq peak profiles. Top: LOLA enrichments colored by the log2 odds ratio of enriched overlap between the region modules and ChIP-seq peaks for the corresponding transcription factor, compared to the background of all regulatory regions in the ATAC-seq dataset. Bottom: Mean expression (normalized UMI count) of the gene encoding each transcription factor in different LCH subsets (showing gene expression in LCH_E, which matches the ATAC-seq data, as well as the mean expression across all patient samples). Further details are provided in Supplementary Table S3.
E) Enrichment of transcription factor binding motifs for LCH-subset-specific modules, based on HOCOMOCO32 motif occurrences identified using FIMO59. Top: Motif enrichments colored by the log2 odds ratio of enriched overlap between the module regions and DNA motif hits for the corresponding transcription factor, compared to the background of all regulatory regions identified in the ATAC-seq dataset. Bottom: Expression levels of the genes encoding the corresponding transcription factors (as in panel D). Right: Consensus DNA motif for selected transcription factors. FDR-adjusted p-value, Fisher’s exact test: *, p < 0.1; **, p < 0.05, ***, p < 0.005.

