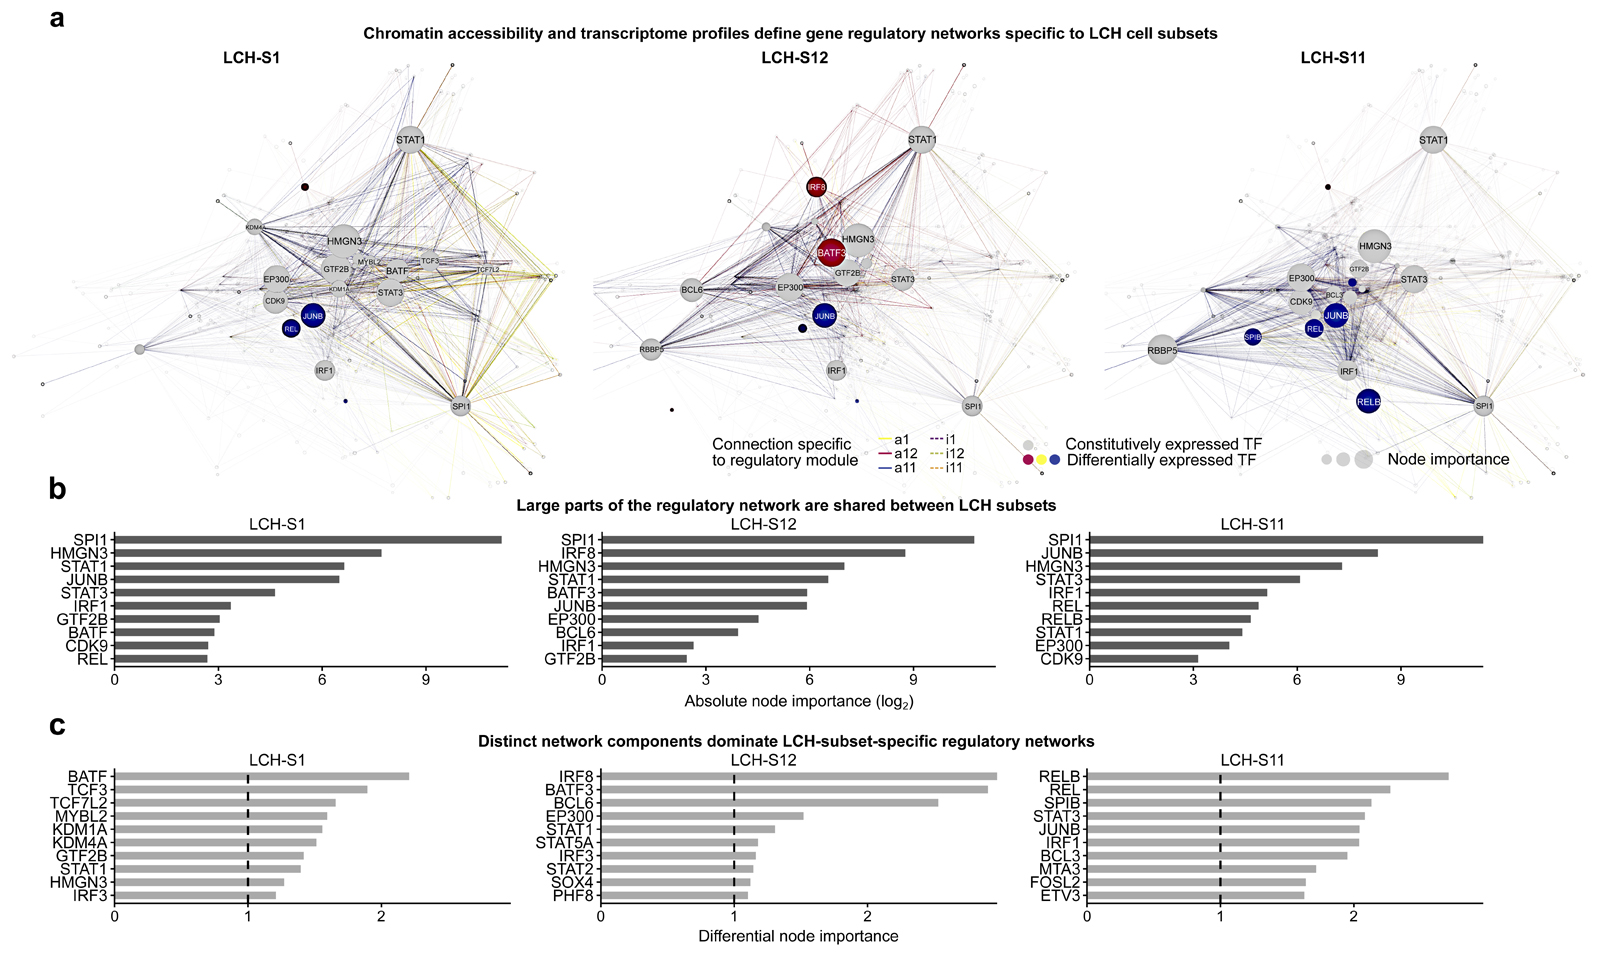
Figure 6. Characteristic gene regulatory networks underlie the observed LCH developmental hierarchy.
A) Gene regulatory networks inferred for three LCH cell subsets (LCH-S1, LCH-S12, LCH-S11), based on single-cell transcriptome and ATAC-seq data, and the key regulators identified by the enrichment analysis in Fig. 5D and E. Nodes in the network correspond to the enriched transcription factors as well as their putative target genes (based on sequence proximity and chromatin 3D structure). Node size is proportional to both gene expression level and node out-degree (i.e., number of outgoing connections from the transcription factor) in the respective LCH subset. Edge colors indicate the module of the corresponding peak, and edge visibility is proportional to chromatin accessibility. The network layout was automatically generated using the igraph package. A browser-based version for interactive data exploration is available in Supplementary File S1 and on the Supplementary Website: http://LCH-hierarchy.computational-epigenetics.org).
B) Bar plots showing the top-10 transcription factors ranked by node importance (calculated as a combination of gene expression level and node out-degree) in the networks in panel A.
C) Bar plots showing the top-10 transcription factors ranked by differential node importance (node importance in one network relative to the mean across all three networks) in the networks in panel A.

