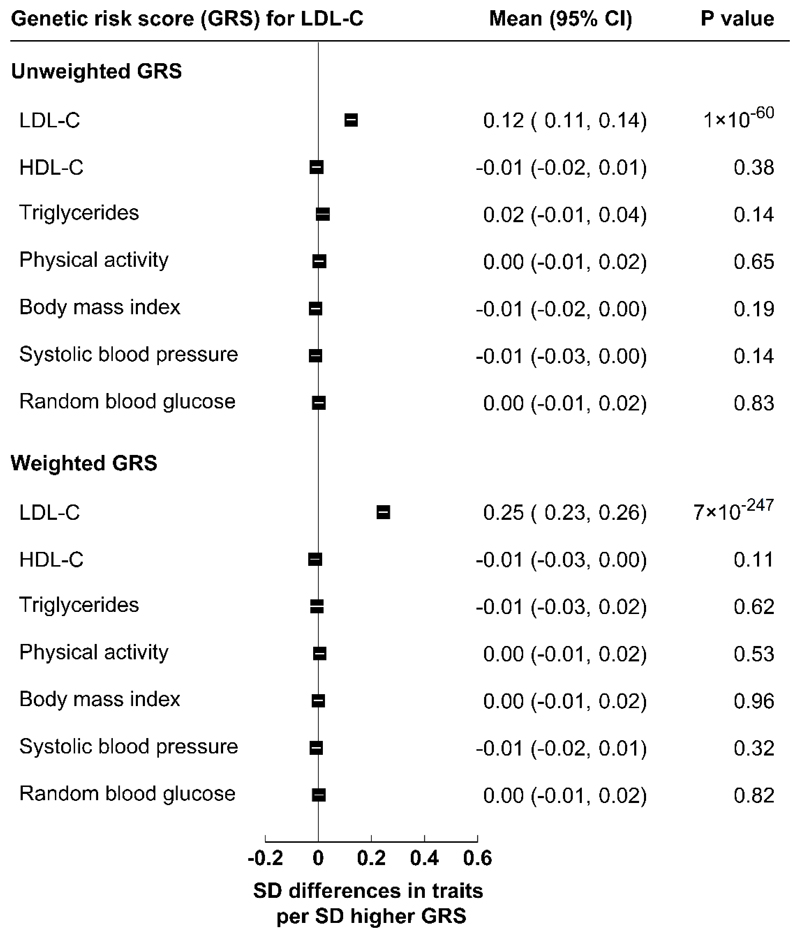
Extended Data Fig. 5. Associations of the genetic risk score (GRS) for LDL-C with major vascular risk factors.
SD=Standard deviation. The analyses were conducted in 17,567 CKB participants with available data, adjusted for sex, age, age-squared, and case status. General linear regression was used to estimate SD differences in all traits (after rank-inverse-normal transformation) per 1 SD higher GRS. All P-values (two-sided) were uncorrected for multiple testing.

