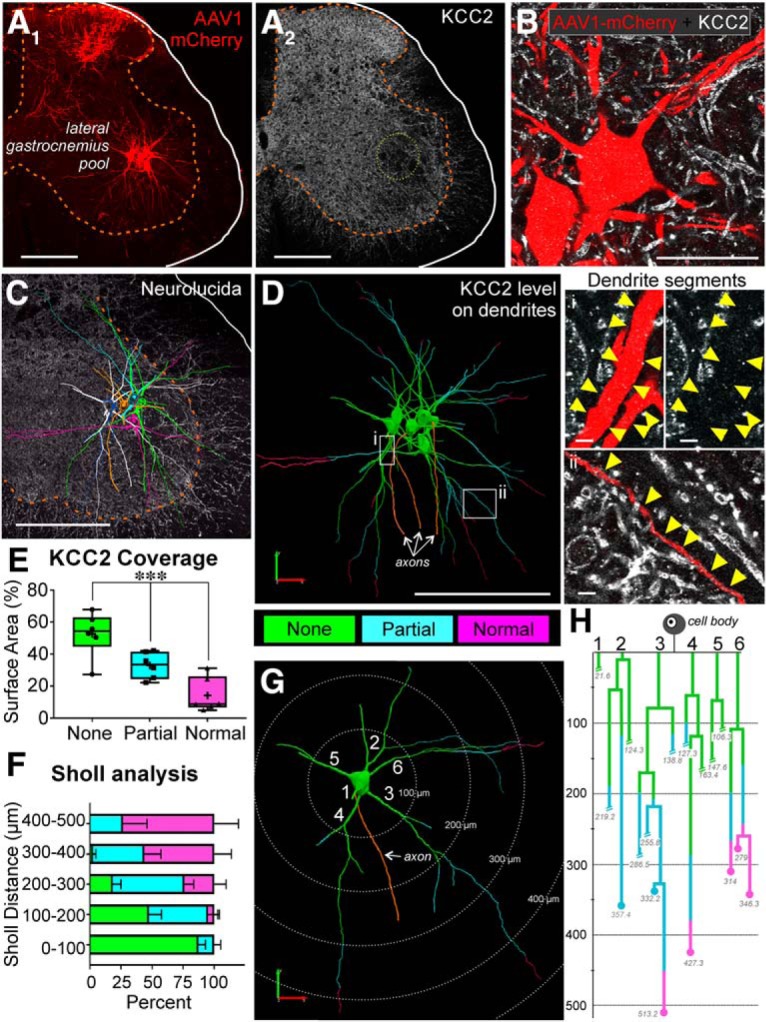
Figure 2.

KCC2 protein is lost extensively from axotomized motoneuron dendrites 14 d after sciatic cut/ligation. A, AAV1-mCherry filled LG motoneurons (A1) and KCC2-IR in the same section (A2) 14 d following sciatic cut/ligation. Note some afferents are also labeled in the dorsal horn after AAV1 mCherry muscle injections. Scale bar = 200 μm. B, High-magnification confocal image through the soma and proximal dendrites of two mCherry-labeled and axotomized motoneurons (mCherry-red). KCC2 immunofluorescence (white) was not observed around the cell body and the proximal dendrites. Scale bar = 50 μm. C, The full dendritic arbor was imaged at high magnification using confocal image tiling and then the neurons reconstructed in 3D using Neurolucida. Example of six individual motoneurons (color-coded) reconstructed within one section with KCC2-IR in the background. Note the extension of dendrites toward the dorsal horn and also entering the white matter. Scale bar = 200 μm. D, Dendrites were color-coded to indicate complete KCC2 loss (green, “none”), partial KCC2 loss (blue), or normal KCC2 levels (pink), relative to surrounding dendrites in the neuropil. Loss of fluorescence in the proximal dendrites was similar to that on the soma membranes (green and region i). IR to KCC2 was partially reduced (blue and region ii) along dendrites for various distances. However, no significant loss of KCC2 was found on distal dendrites; scale bars (i, ii) = 5 μm. E, Box plots of the percentage of surface area in each category (complete depletion, partial depletion, or no depletion) for all dendrites for which the complete length was traceable (not cut short during sectioning). More than half of the available dendritic surface area was completely depleted (Table 4; ***p < 0.001). Box plots represent 25th, median, and 75th percentiles; whiskers = 10th and 90th percentiles. Crosses = mean; points represent average for individual neurons (n = 6, 3.12 ± 0.98 dendrites/animal). F, G, Sholl analysis (100-μm bins) of dendritic length and KCC2 depletion. F, Average (±SD) percentage of dendritic lengths within each bin (n = 7 neurons, 5.29 ± 1.1 dendrites per neuron), illustrating that within the first 200 μm, the majority of dendrites have no KCC2 visible, whereas normal KCC2 levels can be observed at the most distal ends of dendrites. G, Isolated single motoneuron from C separated for Sholl analysis. The majority of KCC2 is completely lost in the first 200 μm of dendrite; at 400 μm, dendritic KCC2 is largely preserved. H, Example dendrogram of the motoneuron in G, color-coded for KCC2 depletion. Dendrite branches ending in circles represent dendrites that were fully contained within the section (quantified in E). Dendrite branches that were cut during sectioning and could not be fully traced are designated with slashes. The majority of dendrites for which the ending could be observed had normal levels of KCC2 present in their terminal regions.
