Figure 3.

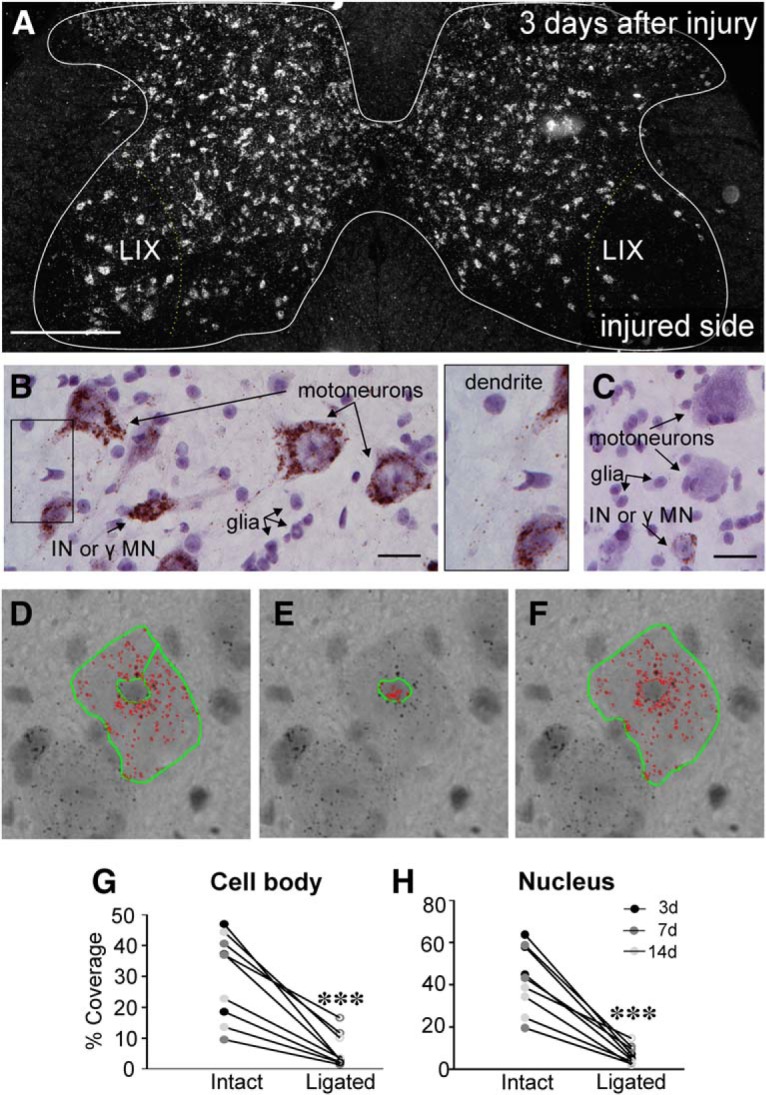
KCC2 mRNA is lost by 3 d after peripheral axotomy. A, Darkfield image of a lumbar 4 section 3 d after unilateral sciatic nerve cut/ligation, processed using RNA-Scope. KCC2 mRNA visualized in white. Scale bar = 200 μm. Very little KCC2 mRNA is found in the area around the injured motor pool (right) in Lamina IX (LIX), relative to the contralateral intact motor pools. B, C, Brightfield images of motoneurons on the intact (B) or cut/ligated (C) sides of the spinal cord 3 d after PNI. Injured motoneurons lose KCC2 mRNA, whereas motoneurons contralateral to injury and interneurons (INs) or γ motoneurons (γMNs) on both sides of the spinal cord maintain KCC2 mRNA. Nuclei from glia are also visible and are more densely concentrated around axotomized neurons. KCC2 mRNA can also be seen extending into dendritic processes of intact motoneurons (rectangle in B, inset). Scale bar = 25 μm. D–F, RNA-Scope quantification procedure. Thresholding was used to highlight KCC2 mRNA (red). Nissl staining caused differences in background intensity, so difference thresholds were required for cytoplasm and nuclear quantification. Thus, the outlines of the motoneuron somata were traced (green) with the nucleus excluded to get the area of KCC2 mRNA within the cytoplasm (D). Nuclei (E) were traced and threshold separately. The total area, including cytoplasm and nucleus (F), was also traced for comparison of total area to KCC2 mRNA area. G, H, Percentage KCC2 coverage of soma (G) and nucleus (H). Animals were euthanized 3, 7, or 14 d (n = 3/group) after unilateral sciatic nerve cut/ligation, and sciatic motoneurons were quantified as described above. There were no differences between levels of KCC2 between time points; only injury state predicted KCC2 levels (Table 4). Thus, data from all time points were pooled and paired t tests were performed comparing motoneurons ipsilateral and contralateral to injury (Table 4; ***p ≤ 0.001).
