Figure 2.

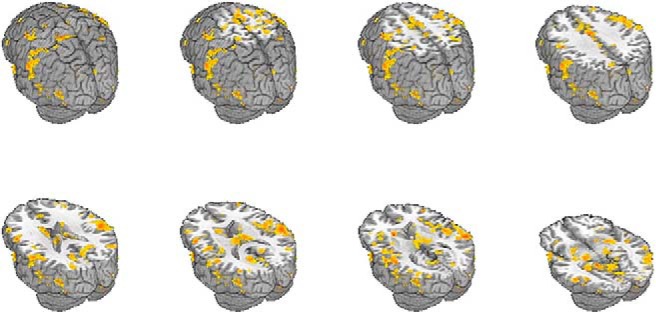
Regions showing significant change in hippocampal FC following PPC rTMS from the current study (FDR corrected, q = 0.05).

Regions showing significant change in hippocampal FC following PPC rTMS from the current study (FDR corrected, q = 0.05).