Figure 2.
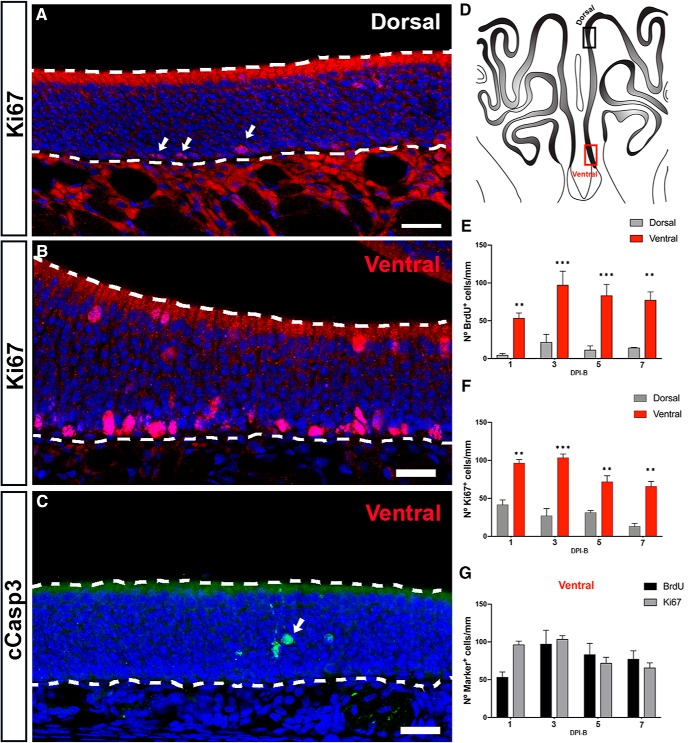
Cell proliferation in the septal wall of the OE in P25 mice. A, B, Maximum intensity projections of confocal z-stacks showing Ki67-expressing cells (red) in the dorsal (A) and ventral (B) domains of the septum. Note the low density of Ki67+ cells in the dorsal zone (arrows). Ki67-labeled cells at the luminal surface of the ventral septum are sustentacular cells. C, Confocal image showing cCasp3-expressing cells in the ventral septal OE (green). Note the low number of apoptotic cells (arrow). D, Illustration of the OE from a coronal perspective. Black and red rectangles represent dorsal and ventral zones of the septal OE, respectively. E, F, Histograms show the number of BrdU+ cells per millimeter (E) and Ki67+ cells per millimeter (F) in the dorsal and ventral zones of the septal OE at different following time points after BrdU injections: DPI-B-1, DPI-B-3, DPI-B-5, and DPI-B-7. The mean ± SEM values are plotted (n = 3). G, Histogram representing the number of BrdU+ and Ki67+ cells in the ventral septal OE. The mean ± SEM values are plotted. **p < 0.01, ***p < 0.001. Dashed white lines delineate the surface of the OE (top) and basal lamina (bottom). DRAQ-5 is in blue. Scale bars, 25 μm.

