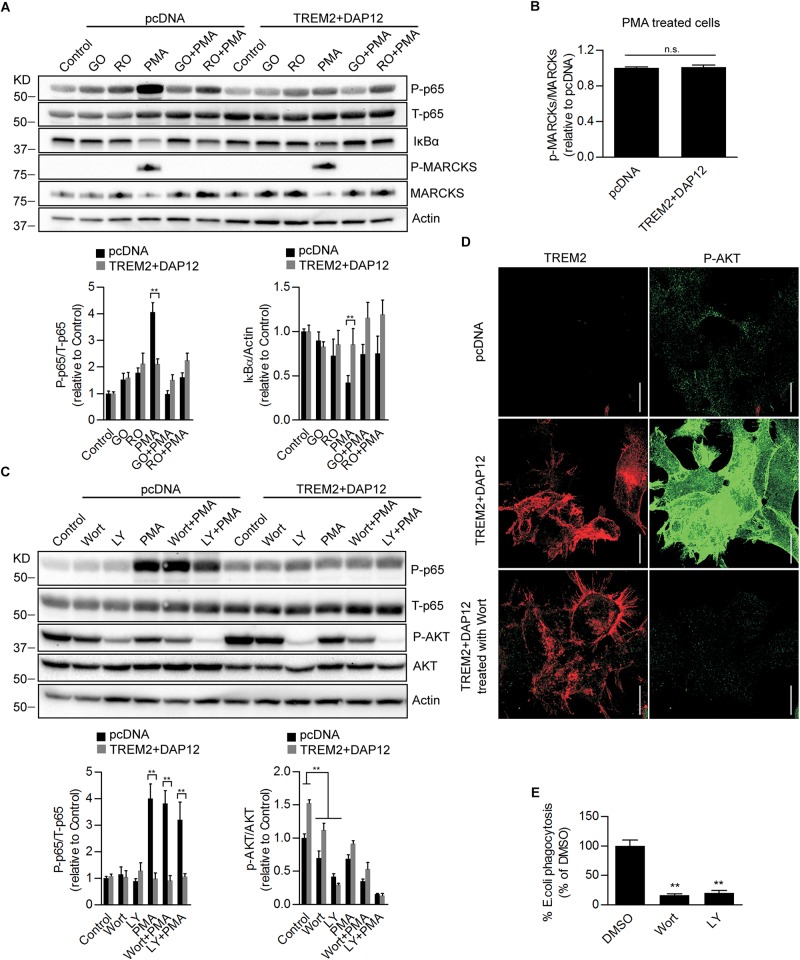
FIGURE 7.
Effects of Pharmacological inhibition of PI3K/AKT signaling on NFκB activation and phagocytosis in TREM2 + DAP12 HEK293 cells. (A) Western-blot analysis of lysates from TREM2 + DAP12 transfected HEK293 cells pretreated with different PKC inhibitors Go 6983 (Go; 5 μM), Ro 32-0432 (Ro; 10 μM) for 1 h, and then challenged with PMA (200 nM) for 1 h. Lower panel: the histograms represent the ratios of P-p65 NFκB (Ser536)/total p65 NFκB and IκBα levels normalized to Actin in control pcDNA (empty vector) cells and in TREM2 + DAP12 HEK93 cells. Data are represented as means ± SD and expressed relative to control pcDNA cells; n = 4 for each experimental condition; statistical significance (∗∗p < 0.01) was evaluated by ANOVA followed by post hoc analyses with Bonferroni correction. (B) The histogram represents the ratios of p-MARCKs/total MARCKs in PMA treated pcDNA (control cells) and TREM2 + DAP12 transfected HEK293 cells. Data are represented as means ± SD and expressed relative to pcDNA transfected cells; n = 4 for each experimental condition; no statistical significance (n.s.; p > 0.05) was found using a two-tailed Student’s t-test. (C) Western blot analysis of lysates from pcDNA (empty vector) and TREM2 + DAP12 transfected HEK293 cells pretreated with different PI3K inhibitors: wortmannin (wort; 200 nM) and LY 294002 (LY; 20 μM) for 1 h, and then challenged with PMA (200 nM) for 1 h. Lower panel: the histograms represent the ratios of P-p65 NFκB (Ser536)/total p65 NFκB (T-p65) and p-AKT(Ser473)/Total AKT levels normalized to Actin quantified in control pcDNA (empty vector) and TREM2 + DAP12 HEK293 cells. Data are represented as means ± SD and expressed relative to control pcDNA (empty vector) transfected HEK293 cells; n = 4 for each experimental condition; statistical significance (∗∗p < 0.01) was evaluated by ANOVA followed by post hoc analyses with Bonferroni corrections. (D) Representative laser confocal images obtained following immunostaining of HEK293 cells transfected with pcDNA (empty vector) and TREM2 + DAP12 HEK293 cells using an N-terminal TREM2 antibody (red), and a p-AKT (Ser473) antibody (green) following treatment of the cells with the PI3K inhibitor wortmannin (wort; 200 nM) for 1 h. The white scale bar represents 20 μm. (E) Phagocytosis of pHrodo E. coli bioparticles conjugate in TREM2 + DAP12 transfected HEK293 cells treated with the PI3K inhibitors wortmannin (wort; 200 nM) and LY 294002 (LY; 20 μM) for 1 h. Data are represented as means ± SD from at least two independent cell culture experiments and expressed relative to DMSO (vehicle) conditions in TREM2 + DAP12 HEK293 cells; n = 6 for each treatment condition; statistical significance (∗∗p < 0.01) was evaluated by one-way ANOVA followed by post hoc analyses with Bonferroni corrections.

