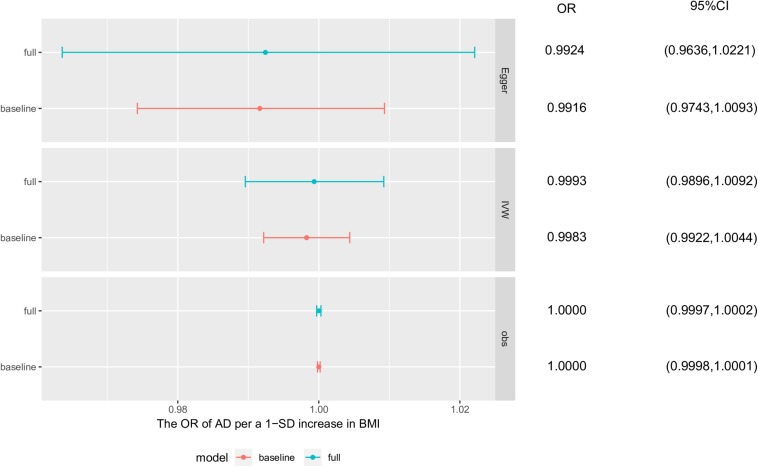
FIGURE 4.
Survivor bias. The causal effects of these simulation analyses were obtained separately from base survivor model and full survivor model using observational study, inverse-variance weighted method and MR-egger method. Each point and horizontal line denote the mean estimated causal effect and 95% confidence interval (CI) from corresponding model and method. AD, Alzheimer’s disease; BMI, body mass index; baseline, baseline survivor model without survivor bias; full, full survivor model with selected mortality.

