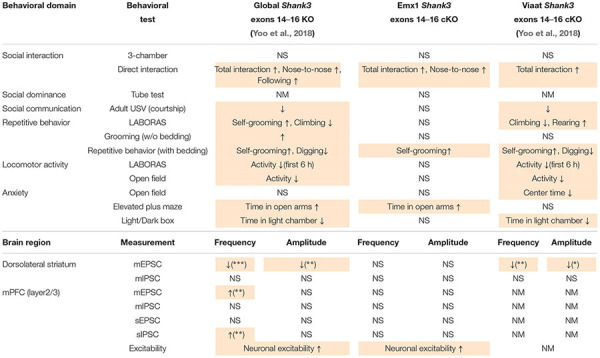
TABLE 1.
Comparison of electrophysiological and behavioral phenotypes of global Shank3Δ14–16, Emx1-Cre;Shank3Δ14–16, and Viaat-Cre;Shank3Δ14–16 mice.
 |
Table summarizes increases or decreases in various electrophysiological and behavioral phenotypes in a given mouse line relative to WT/control mice, but is not intended to compare phenotypic severities across different mouse lines. ∗P < 0.05, ∗∗P < 0.01, and ∗∗∗P < 0.001; NS, no significant change; NM, not measured; up and down arrows, increases and decreases, respectively. Areas shaded in orange represent similar phenotypes.
