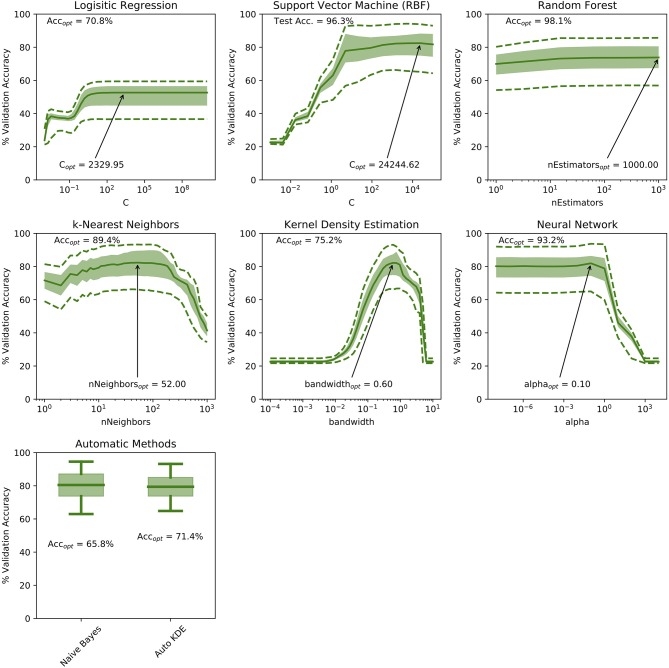
Figure 2.
Demonstration of cross-validation accuracies over the range of hyper-parameters tested in this study. For the Kernel Density Estimation and k-Nearest Neighbor methods, an optimum hyper-parameter can be identified. For the remaining techniques, a hyper-parameter limit is identified by the presence of a plateau in the validation accuracy curve. Solid curves represent median values, shaded areas demonstrate the interquartile range and dashed lines represent the 5th and 95th percentiles of the validation accuracy measurements. The optimum hyper parameter is annotated on each sub-plot with the corresponding validation accuracy shown in the top-left.

