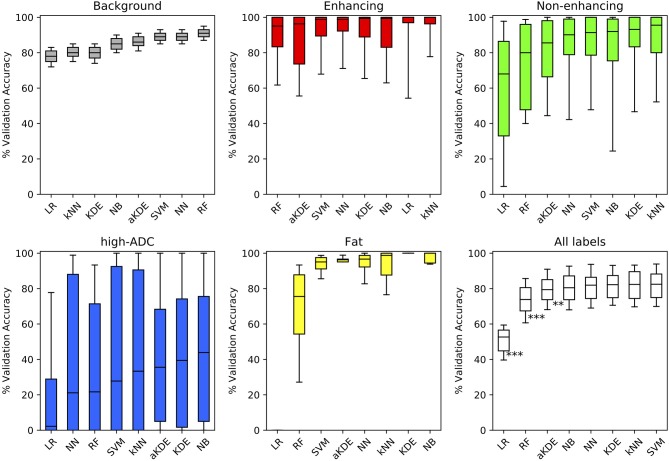
Figure 3.
Comparison of the validation accuracy for the different machine learning (ML) techniques applied to our labeled training-set data. Methods are compared for each tissue label separately (colored as per Figure 1) and for all tissue types combined (white). Boxplots demonstrate the distribution of validation accuracies (derived using a randomized cross-validation approach) following optimization of hyper-parameters (bold-lines represent median, shaded areas indicate the inter-quartile range and whiskers the 5th/95th percentiles). Methods are ordered from left to right in order of increasing median accuracy (**p < 0.005, ***p < 0.0005).

