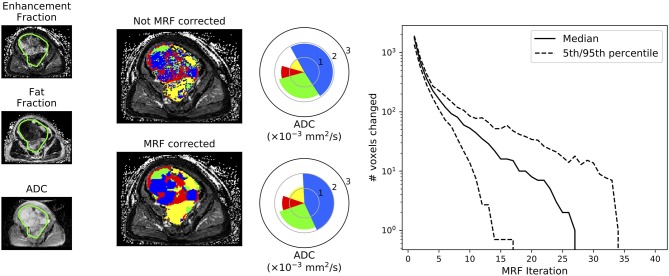
Figure 4.
Demonstration of the improvement to tissue sub-region classification following Markov Random Field (MRF) correction of the Naïve-Bayes classifier. This figure demonstrates results for the patient that was not included in the training of our machine-learning approaches (test data). Spie-charts (14) demonstrate the proportion of each tissue sub-compartment within the entire volume as the angle of each segment, whilst the mean ADC of each tissue sub-type is represented by the radius of each segment (note that the ADC of the fat/yellow tissue sub-type from fat-suppressed diffusion-weighted imaging studies should not be interpreted as it will be heavily noise-corrupted; only the proportion/angle of this tissue sub-type is informative). The far-right plot demonstrates the number of voxels that change classification following each iteration through the MRF fitting algorithm across all axial images in this patient: it is evident that the algorithm converges after a finite number of iterations.

