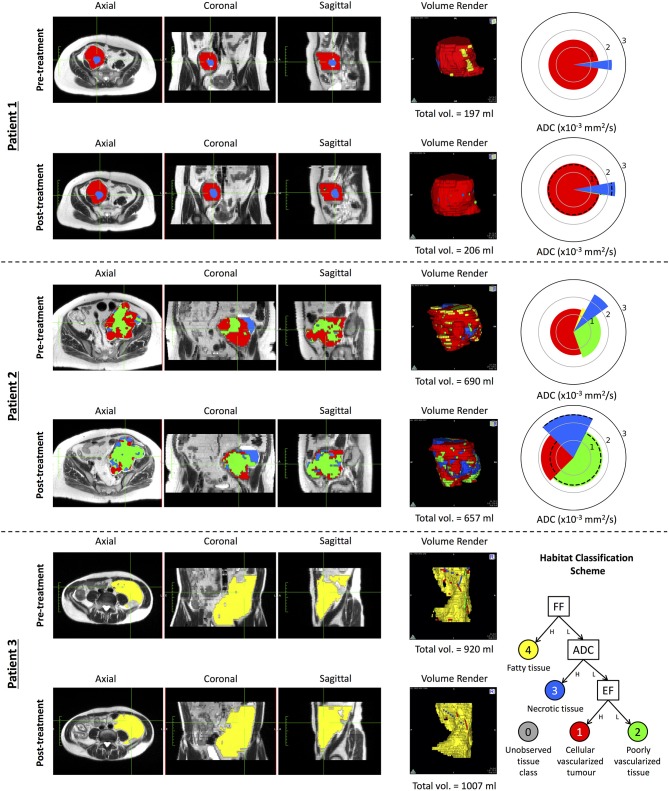
Figure 5.
A demonstration of our proposed habitat classification scheme on three patients applied before and after radiation therapy. Spie charts are presented with a radius equal to the mean ADC of the given tissue sub-compartment; dotted lines on the post-treatment Spie charts show the ADC of that tissue sub-type in the pre-treatment data. Multi-planar reformat habitat maps are overlain on T2 HASTE MR-images acquired within the same patient study. Patient 1 demonstrates a patient with a liposarcoma where a necrotic core is clearly identified (blue) within a majority of strongly enhancing solid tumor (red) prior to treatment. Although there is a marginal increase in the volume of the necrotic core, there little overall change is observed following treatment. Patient 2 demonstrates data from a pleomorphic sarcoma where there is a clear heterogeneous pattern observed with the majority of the disease consisting of strongly enhancing tumor. Following treatment, there is a marked increase in the proportion of poorly vascularized (green) and necrotic tissue. Within the remaining strongly enhancing tumor after radiotherapy, an increase in mean ADC is observed indicative of treatment response. Patient 3 demonstrates a well-differentiated liposarcoma with the majority of the tumor consisting of fatty tissue before and after treatment. Results for all eight patients (including these three exemplary patients)with pre-/post-radiotherapy imaging are provided as supplementary information in Appendix C.

