Figure 10.
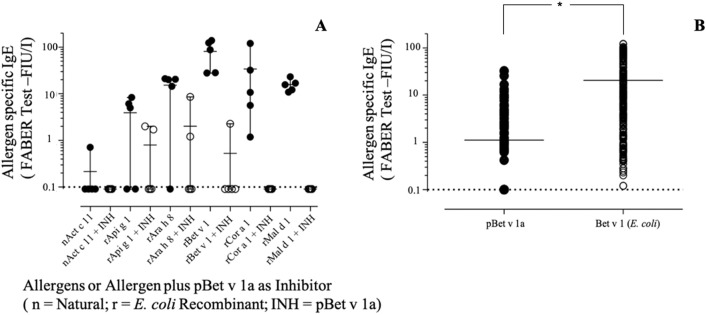
(A) Specific IgE-binding inhibition using pBet v 1a on Bet v 1-like molecules on the FABER test solid phase. (B) Specific IgE direct comparative binding using 304 Bet v 1 IgE-positive sera and statistical evaluation of IgE value distributions by using the t-test for paired values (p < 0.0001), displayed by the asterisk.

