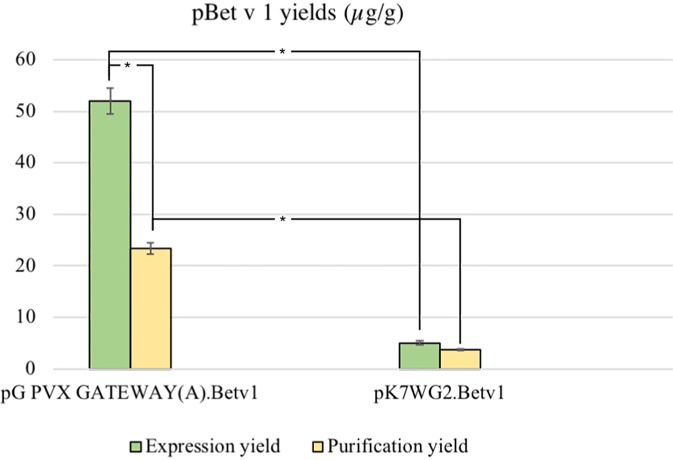
Figure 4.
Average yields µg/g LFW of purified protein between the two expression systems. The expression and purification yields are reported, respectively, in green and yellow. The bars represent the standard deviations of three independent purification experiments, asterisks indicates the statiscal significance evaluated by t-test (p < 0.01).

