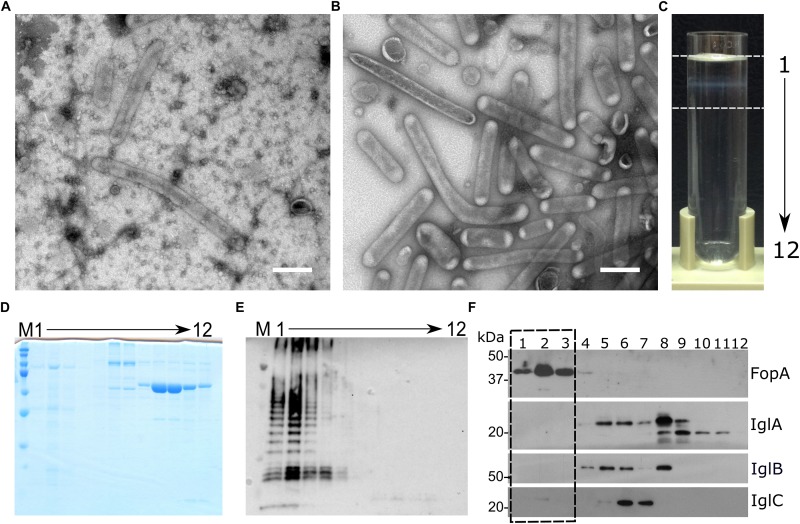
FIGURE 1.
OMV isolation and purification. (A) TEM of pelleted culture filtrate and (B) OMV purified by density gradient; (C) density gradient separation – fractions 1–12 were collected from the top, white opaque band between the dashed lines corresponds to purified OMV; (D) SDS-PAGE of the density gradient fractions; (E) Western blot detection of LPS in the density gradient fractions; (F) Western blot detection of vesicular marker FopA and proteins IglA, IglB, and IglC in the density gradient fractions, dashed box highlights fractions 1–3 which were combined and taken as the OMV fraction for further analyses, corresponds to the part of the density gradient between the dashed lines in panel (C). M, MW marker; 1–12, density gradient fractions collected from the top of the density gradient; A and B bars: 200 nm.

