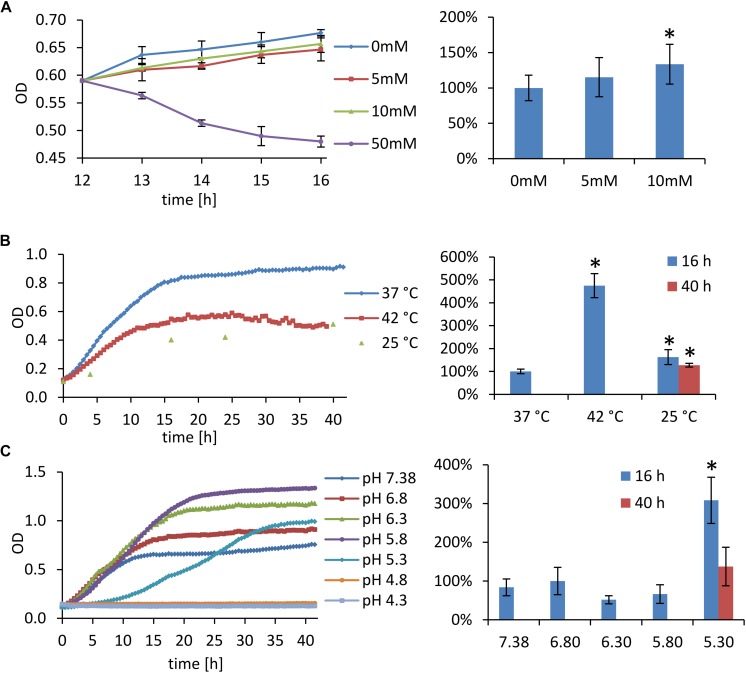
FIGURE 4.
Stress cultivation growth curves (left) and relative vesiculation rates (right). Fluorescence of the culture media was normalized to CFU/mL and expressed as percent of the control cultivation. (A) Oxidative stress: bacteria were grown for 12 h under standard cultivation conditions, then they were treated with 5–50 mM H2O2 (50 mM H2O2 had a considerable bactericidal effect, large amount of dead cells distorted OMV quantification); (B) high and low temperature stress; and (C) cultivation at different pH. Results show ratios ±SD from six to nine independent experiments; ∗ significant (p < 0.01) against control cultivation.

