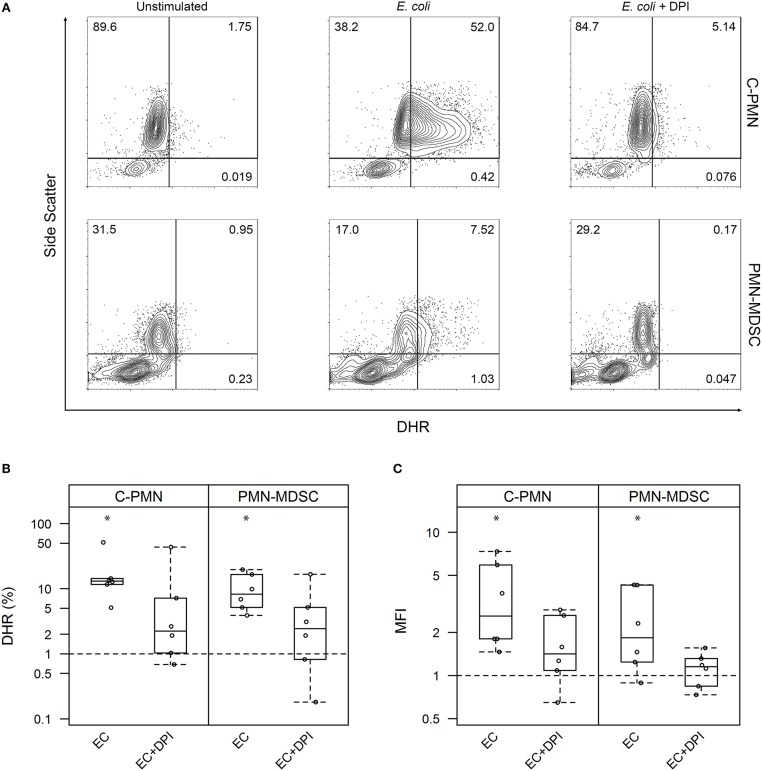
Figure 1.
Exposure of PMNs and PMN-MDSCs from tumor-bearing dogs to E. coli leads to production of reactive oxygen species. (A) Exemplar of flow cytometric data for C-PMNs and PMN-MDSCs isolated from the same tumor-bearing dog. Numbers indicate frequency of total cells that fall within each gate. (B,C) Summary of all experiments displaying results as a measure of (B) proportion of CADO48A+ cells that are DHR+ and (C) MFI of CADO48A+ cells on the DHR channel. DPI was used to inhibit NADPH oxidase production of ROS. Percentage or MFI of DHR+ cells following exposure to E. coli is normalized to the percentage or MFI of DHR+ cells under the unstimulated condition. An asterisk denotes p < 0.01 and is based on a least square means analysis, comparing each condition to the normalized unstimulated condition (y = 1). Each dot represents a different dog. Box-and-whisker plots display the 25th and 75th percentile with median indicated by the center line, while the whiskers indicate the lowest and the highest data points still within 1.5 times the interquartile range of the respective lower and upper quartiles. C, cancer; PMN, polymorphonuclear cell; ROS, reactive oxygen species; MFI, mean fluorescence intensity; DPI, diphenyleneiodonium; DHR, dihydrorhodamine-123; EC, E. coli.

