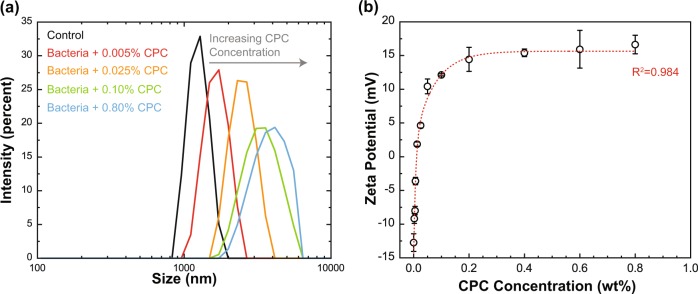
Fig. 1.
Hydrodynamic size (intensity averaged) of Salmonella Typhimurium as a function of concentration of CPC (a) obtained by dynamic light scattering and the change in the average ζ-potential (mV) of Salmonella Typhimurium cells with addition of CPC (b). Symbols depict mean values from three independent replications while error bars depict one sample s.d. (N = 3). The fitted trend line (dashed) is the two-phase (double) exponential decay model with the coefficient of determination of 0.984

