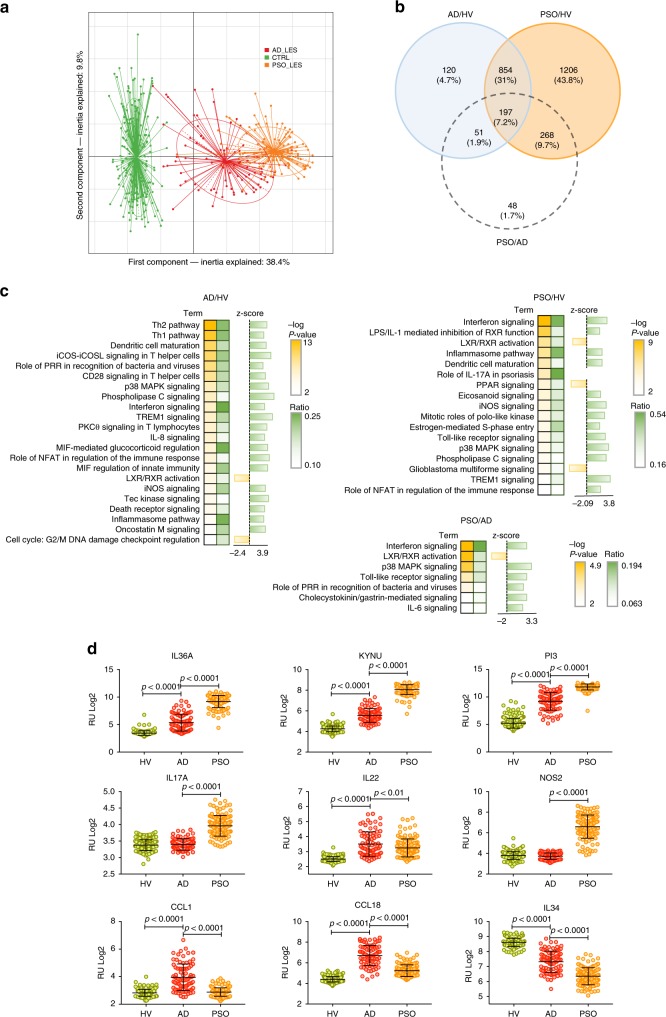
Fig. 3.
The AD and PSO skin transcriptomes. a Projection of AD (red, n = 82), PSO (orange, n = 119) and HV (green, n = 115) transcriptome profiles in the subspace spanned by the two first components of the principal component analysis (PCA) performed on the 1000 most variant genes. b Venn diagram of the differentially expressed genes in the AD vs. HV, PSO vs. HV and PSO vs. AD contrasts (identified using the Limma linear model and empirical Bayes method, cut-off: log2 FC > 0.58 and FDR p < 1 × 10⁻⁵, corrected using the Benjamini−Hochberg method). c IPA canonic pathway analysis of significantly enriched functions in AD and PSO gene signatures and the PSO vs. AD contrast. d Statistical analysis (unpaired t test) of selected top up- and downregulated genes. The center line in the dot plots corresponds to the mean, and the error bars to the standard deviation. The source data files used to generate the present figure are available from EBI ArrayExpress under accession E-MTAB-8149

