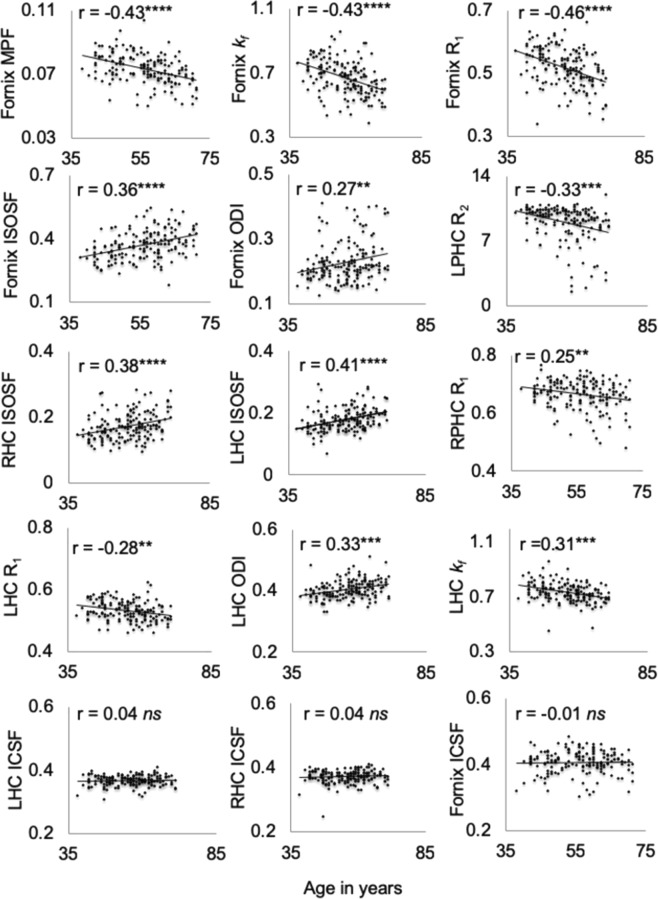
Figure 1.
Scatterplots of the correlations and Pearson coefficients (controlled for intracranial volume) between age and white and gray matter microstructural indices. Abbr.: ICSF = intracellular signal fraction, ISOSF = isotropic signal fraction, kf = forward exchange rate, LHC = left hippocampus, LPHC = left parahippocampal cingulum, MPF = Macromolecular proton fraction, ODI = orientation dispersion index, R = longitudinal relaxation rate, RHC = right hippocampus, RPHC = right parahippocampal cingulum ****p < 0.0001, ***p < 0.001, **p < 0.01 (5% False Discovery Rate Benjamini-Hochberg adjusted p-values).

