Figure 2.
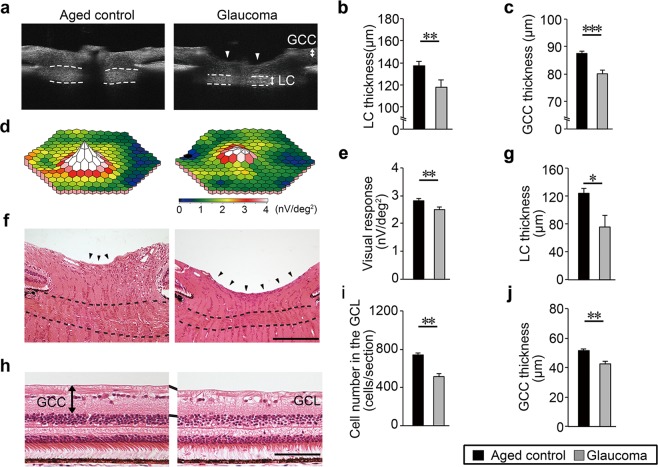
Degeneration of the optic nerve and retina, and impaired retinal function in glaucomatous marmosets. (a) In vivo imaging of the optic disc by vertical scan through the centre of the optic disc by SD-OCT. Arrowheads indicate the cupping of the optic disc and dotted lines indicate the LC. LC: lamina cribrosa, GCC: ganglion cell complex. (b,c) Quantitative analysis of the thickness of the LC (b) and GCC (c). n = 28 (aged) and 6 (glaucoma). (d) Three-dimensional plots of the retinal responses as examined by multifocal electroretinogram (mfERG). A higher score (white) indicates highly sensitive visual function. Values are given in nV per square degree (nV/deg2). (e) Quantitative analysis of the visual responses. n = 28 (aged) and 6 (glaucoma). (f) H&E staining of the optic nerve head. Enhanced optic disc cupping (arrowheads) and thinning of the LC (dotted lines) are apparent in the glaucomatous marmoset. Scale bar: 200 µm. (g) Quantitative analysis of the LC thickness. n = 3 per group. (h) H&E staining of the retina. Inner retinal degeneration is observed in the glaucomatous marmoset. The mid-peripheral region is shown. Scale bar: 100 µm. GCL: ganglion cell layer. (i,j) Quantitative analysis of the cell number in the GCL (i) and GCC thickness (j). n = 3 per group. The data are presented as means ± S.E.M. *P < 0.05; **P < 0.01, ***P < 0.001.

