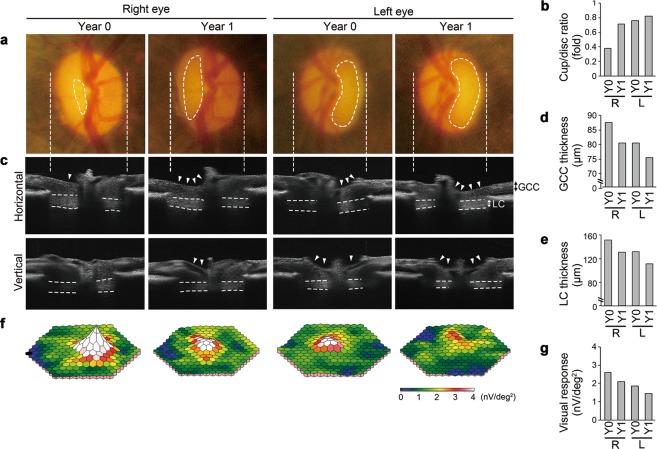
Figure 5.
Follow-up studies of a glaucomatous marmoset over 12 months. (a) Ocular fundus photographs of initial examination (Year 0) and one year later (Year 1) in the glaucomatous marmoset (No. 34 in Supplementary Table 1). Dotted lines indicate the cupping of the optic disc. (b) Quantitative analysis of the vertical cup/disc ratio. R: right eye, L: left eye, Y0: year 0, Y1: year 1. (c) In vivo imaging of the optic disc by the horizontal and vertical scan through the centre of the optic disc by SD-OCT. Arrowheads indicate the cupping of the optic disc and dotted lines indicate the LC. (d) Longitudinal evaluations of the GCC thickness by a circular scan around the optic disc by SD-OCT. (e) Quantitative analysis of the LC thickness by cross-sectional images of the optic disc by SD-OCT. (f) Three-dimensional plots of the retinal responses as examined by mfERG. Values are given in nV per square degree (nV/deg2). (g) Quantitative analysis of the visual responses in (f).

