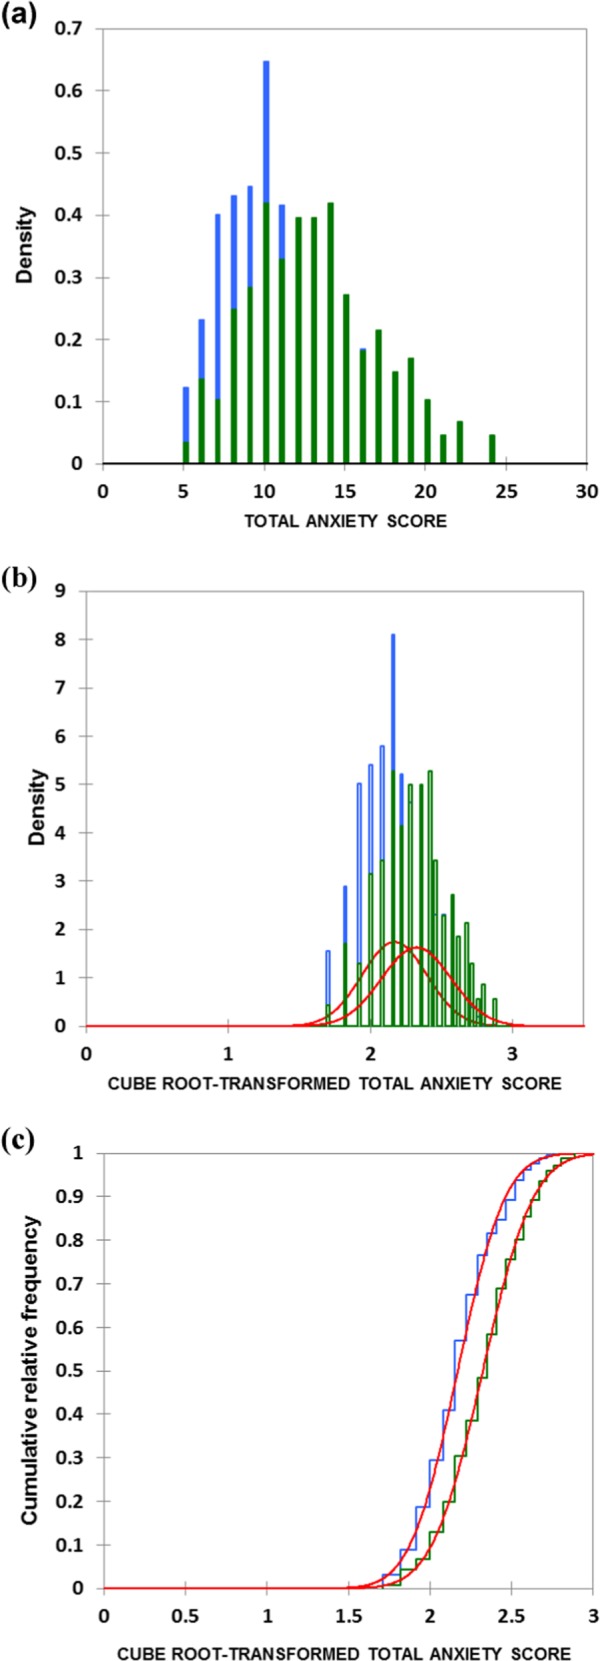
Fig. 1.

Normality distribution density plots of (a) the untransformed (raw data) total dental anxiety scores for first- and final-year BDS students (green and blue respectively), and (b) following cube root transformation of these datasets. Fitted normal distributions are depicted in red in (b). c Plots of cumulative relative frequency against the cube root-transformed total dental anxiety scores for first- and final-year BDS students (blue and green respectively), demonstrating an excellent fit to a normal distribution curves (red) for both groups
